Alright, so there were many questions and speculations about how Elvenar Spire squad size(s) are calculated. As far as I can tell, the calculation was never disclosed, except for statements that many different things have an impact on that – including total AW levels. But what is the formula? We described our latest model in Spire Squad Size – Iteration 2. But with additional data come new insights. Sometimes. Or things can just get more confusing. So it is time for another update. Unfortunately, we won’t get a new model this time, so we’ll rename Iteration to Model, and call it Model v2.1.
Table of Contents
* – * – *
Data Collection
So over the last few months I’ve been collecting data on the Spire, and now I am running a wider data collection effort. You can contribute to it in the comments below or on the forums here:
Spire squad size calc – we need your data!
The post in the link above also explains what’s needed and how to get it. We need your input! Also, look at the section below that further describes what is needed. The more people participate, the faster we can converge to a reasonable model. Hopefully 😉
Definitions
Before we jump into the modeling, let me just say that when I say Spire squad size calculation I mean your own Spire squad size in the very first encounter (e.g. encounter 1 at stage 1 – Gateway). Once you know that number, you can calculate the rest of the Spire squad sizes in all the other encounters (both your own and your enemy’s). I already have that data, and it is described in Spire Requirements Calculation. Here we’ll work on the still unresolved issue of calculating that base Spire squad size number.
Modeling Issues
OK, so Iteration 2 results looked pretty good. But keep in mind that most of the datapoints there were pretty close to each other. With more datapoints some incremental results on AW upgrades and/or expansions were quite unexpected – even though the total numbers still looked good.
At the same time Chapter 16 just hit live. This means we don’t have a fairly stable population of end-game cities where changes are mostly limited to AW upgrades. We won’t have similar setup for quite some time, probably a few months.
Change of Focus
All this points out to a need of changing focus in this investigation. I think we’ve reached a point where additional results that combine multiple changing variables (and that’s the case with most of the active cities) provide very limited additional insight. These would still be useful later on for validating model results, but in order to specifically target individual components of the calculation we need targeted experiments. This means changing just one variable at a time, and observing how that changes the calculation.
We need your cities!
To do that, I am still looking for players who have frozen/inactive cities, and are willing to run some dedicated Spire experiments. Here are the requirements:
- Access to Spire, so chapter 3+
- Ability to make no changes to the city except for the ones that are part of the experiment – for a few weeks
- No changes means no research, no new expansions, no AW construction / upgrades
- Production / collection, scouting, map negotiation, tournament playing, KP donations are all fine! (but the less activity there is, the better)
- You do NOT need to actually play the Spire (but you can if you want to, it doesn’t seem to have any impact)
- Ability to place some AWs and/or expansions (but there are some experiments that don’t require that)
I have a few players contributing such data, but we need more! Abandoned cities and/or diamond farms would work well for this. If you can help, please contact me either here or on the US forums.
Spire Experiments
Here are the kinds of experiments I am thinking about so far:
- Place some KPs into research, but don’t unlock it
- Unlock some research without donating any KPs
- Build 1x L1 AW (different ones)
- Upgrade 1x AW (different ones)
- Place 1x (or more) expansions
- Upgrade Main Hall
- There could be more, depending on results
Investigation Streams
With that, we will be focusing on 4 different investigation streams that will deal with different aspects of the model:
- Expansions
- Ancient Wonders
- Research
- Impact of anything else not accounted in the above
Rounding
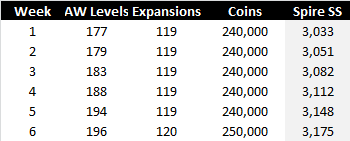
OK, before we continue, I’ll need to mention that a lot of the analysis could be obscured by internal rounding. Let me explain. As you probably noticed, catering costs in the Spire are always rounded to some “round” numbers. E.g. coins will be rounded to the nearest 10K if the number is between 100K-1mm; it is rounded to the nearest 100K if it is between 1m-10mm etc. So we may see something like this over period of several weeks (this is a real example):

So what would happen if we only observe coin catering costs (and won’t see base Spire SS)? We will likely conclude that AW levels have no impact on calculation whatsoever – after all, we added some non-trivial amounts of AW levels (17 in total) over 5 weeks, and coins didn’t budge at all. But once we added 1 expansion, it moved right away. This would seem like a very safe conclusion given the amount of data we observed.
Bah Humbug!
…And as we now know, it would be entirely wrong. You can see what is happening here as we actually can observe base Spire SS. It is slowly trickling up with AW upgrades, but not enough to trigger coins change due to pretty coarse rounding there. Then at some point the new value triggers, and we observe much higher impact than it really is. In the example above we will assume that expansions have much bigger impact than it should be. 250K/240K increase is ~4.2%, while in reality it is less than 0.9% (3175/3148), and even less because 2 AW levels also contribute.
It is entirely possible that we would observe jump from 240K to 250K in, say, week 3. And then we will try to spend a lot of time trying to figure out why some AW levels contribute nothing, and some contribute quite a bit. Which is a complete red herring in this setup as they all contribute – we just don’t quite see it.
…and Spire SS, too!
Now, it is entirely possible that something like that happens with the base Spire SS itself. Some internal variables (that we actually do not see) get rounded, and that telegraphs into the observable base Spire SS as some weird jumps around that make little sense. And even though we only see integer amounts of base Spire SS, we know that base Spire SS is not an integer. How do we know? Well, by observing squad sizes at different points in the Spire. E.g. the last boss SS is 6x base Spire SS, so when we see 3,148 base SS in week 5 we would expect to see 18,888 at the final boss. Yet in this case we can observe 18,883, indicating that true base SS is more like 18,883/6 = 3,147.2 rather than straight 3,148.
All hope is lost?
So, is all hope lost then, if internal rounding is a thing? Well, not exactly – even though it would make things significantly more difficult to figure out. Rounding effectively erases some of the information that we observe. E.g. 3.7, 3.8 and 3.9 can all be rounded to the same 4.0 number, so we cannot differentiate between different underlying numbers based on the observable (4.0) alone.
One way of dealing with issues like this is to collect a ton more data, and average it out. Over larger data arrays we should be able to see original patterns which may have been obscured by rounding. This means not just observing impact of, say, 1 extra AW level (which may appear to be almost random) – but impact of 10, 20 or 50 AW levels. The bigger the impact, the less chance that rounding introduced significant bias into the results. So, did I mention a ton of data? 😉
There are also some other nuances to that, but I will talk about it in individual sections below.
The reason I’ve spent so much time describing rounding in so much detail is that it can potentially explain why there are some outliers even if overall pattern seems to be fairly clear. By no means it is established yet that this is an issue, but it can be an explanation to many things, and I will refer to this possibility often later on.
Data is not perfect
Another reason for outliers is the nature of the collected data. Crowdsourced data is basically never perfect (as far as any real data can be perfect). People make mistakes in setting things up, reporting numbers etc. That’s on top of the fact that there could be different times for snapping Spire data, whether under construction AWs matter etc etc. So some outliers are to be expected – as long as overall pattern makes sense, and outliers are limited. But basically, with the data like that I wouldn’t expect perfect fit even with the entirely correct model.
Model v2.1 Components
Analysis of each of these model components turned out to be quite sizable, so I decided to split those into separate posts. You can find links to these here.
Expansions
Ancient Wonders
Research
Everything Else
Conclusion
Well, it’s too bad we didn’t get a new and improved model this time. But I believe we reached as far as we could with the chapter 15 data. Remember, our previous model was only applicable to this end-game scenario. Now to make a proper model that would work across the board, we will need to incorporate data from different scenarios. And most of the existing data for non-end-game conflates several changing variables together, so it is harder to make sense of.
That’s why it is important to get data that shows impact of only one variable changed. I know, I said that a few times already, but this is important 😉 Without that, it may take a lot longer to figure out what is going on under the hood.
And I am certain we’ll figure it out. Eventually 😉


![Read more about the article Elvenar Sorcerers & Dragons – Day 31 [87%]](https://minmaxgame.com/wp-content/uploads/2019/05/SDFeaturedD31-300x113.png)
![Read more about the article Elvenar Woodelves – Day 17 [54%]](https://minmaxgame.com/wp-content/uploads/2019/03/WoodelvesFeaturedD17-300x113.png)
![Read more about the article Elvenar Orcs – Day 27 [71%]](https://minmaxgame.com/wp-content/uploads/2019/03/OrcsFeaturedD27-300x113.png)
![Read more about the article Elvenar Orcs – Day 29 [76%]](https://minmaxgame.com/wp-content/uploads/2019/03/OrcsFeaturedD29-300x113.png)
![Read more about the article Elvenar Sorcerers & Dragons – Day 01 [04%]](https://minmaxgame.com/wp-content/uploads/2019/04/SDFeaturedD01-300x113.png)
![Read more about the article Elvenar Orcs – Day 30 [78%]](https://minmaxgame.com/wp-content/uploads/2019/03/OrcsFeaturedD30-300x113.png)