Alright, so there were many questions and speculations about how Elvenar Spire squad size(s) are calculated. As far as I can tell, the calculation was never disclosed, except for statements that many different things have an impact on that – including total AW levels. But what is the formula? We have already got some preliminary results in Spire Squad Size – Iteration 1. But with additional data come new insights. So guess what? It is time for Iteration 2 😉
Table of Contents
* – * – *
Data Collection
So over the last few months I’ve been collecting data on the Spire, and now I am running a wider data collection effort. You can contribute to it in the comments below or on the forums here:
Spire squad size calc – we need your data!
The post in the link above also explains what’s needed and how to get it. We need your input! The more people participate, the faster we can converge to a reasonable model. Hopefully 😉
Definitions
Before we jump into the modeling, let me just say that when I say Spire squad size calculation I mean your own Spire squad size in the very first encounter (e.g. encounter 1 at stage 1 – Gateway). Once you know that number, you can calculate the rest of the Spire squad sizes in all the other encounters (both your own and your enemy’s). I already have that data, and it is described in Spire Requirements Calculation. Here we’ll work on the still unresolved issue of calculating that base Spire squad size number.
Issues with Iteration 1 Model
Alright, so we’ve got pretty good results for Iteration 1, right? We did! Alas, just as I promised, that model is wrong 😉 We’re still looking at the end game scenarios, but now we’ve expanded this dataset from 32 datapoints up to 49. And some of these new datapoints are quite far out comparing to the bulk of the previous results (think 700+ AW levels and close to max number of provinces). And having outliers is always good to stress test your model.
So if we just pop in all these datapoints into our Iteration 1 model, here is how it will look like:
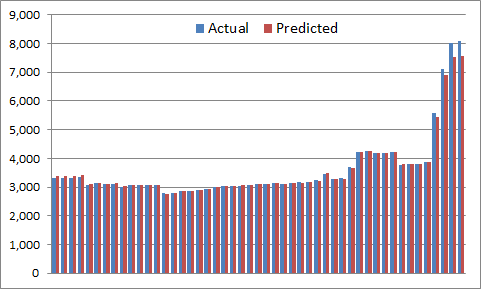
It is still not terrible, but you can see that on the extreme end things started to break down. It is easier to see if we chart just differences:
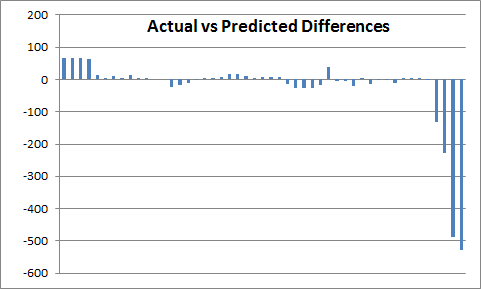
As you can see now, for most common end-game scenarios our Iteration 1 model works really well – the error is usually less than 50. But! For those more extreme cases the errors start to balloon, and get into 500+ category. Clearly, there is some room for improvement here 😉
Cost of Expansions
But that’s not all. As you may recall, Iteration 1 model stipulated that all expansions have a fixed Spire SS cost of 25. Well, about that…
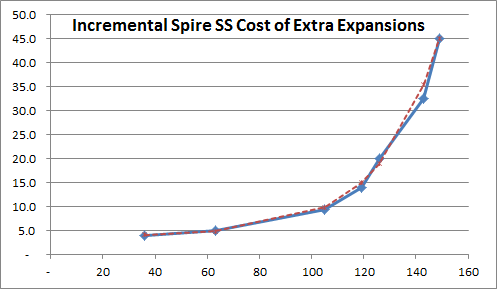
We don’t have too many datapoints on this, and the ones that we have are not necessarily all clean, but it does not look like constant 25 to me 😉
Let’s see what we can do about that.
Iteration 2 Model
It is time to make things better. But probably more complicated. But probably still better 😉
Variable Elimination
First things first – with extra information gathered so far we can finally start eliminating some of the variables that certainly (well, almost ;)) have no impact on the Spire squad size calculation. So here we go – a list of things that do not matter:
- Number of map provinces
- Whether just scouted, partially negotiated, fully negotiated (open) – this number does not seem to impact Spire SS at all
- Extra expansions available for placement
- The fact that you have extra expansions that you can place – from research or map negotiation – does not change Spire SS. Only the ones that are actually placed matter.
- KP contributions to Ancient Wonders
- These do not matter as long as you do not actually upgrade the Wonders
- Playing tournament and/or Spire
- You can go hard on tournament and/or Spire, and it won’t change your Spire SS by itself
This is a great result already. The more variables we can eliminate, the easier it would be to see dependencies for the factors that do matter. We’re on the right track here!
Cost of Extra Expansions
Alright, so the chart of cost of extra expansions above does not look like a constant anything. But it sure looks familiar. Like, you know, exponential curve? 😉 So with some twiddling we can approximate our current expansion data like this:
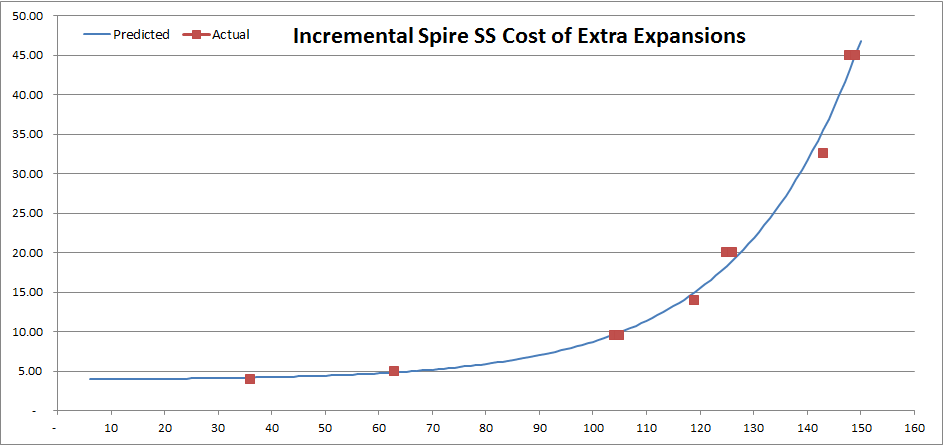
Not too bad! I won’t be writing actual coefficients here as I doubt this is how this is actually calculated. Probably just a table built out using a model like this (if confirmed, that is). It certainly looks better than flat 25 😉
This would penalize higher expansion numbers quite noticeably. And you can see the span of increments here – expansion 36 added just 4 points to the base Spire SS, while adding last 2 expansions – 148 and 149 – added net total of 90.
The reason why flat 25 worked for most of the data points that we looked at before is that most of them were in that 120-130 expansions range where 25 is roughly what this model would indicate.
Now, the chart above is about incremental cost of extra expansions, but we will need to figure out the total contribution of expansions to the Spire SS. Like this:
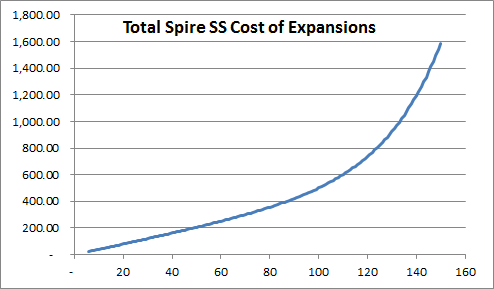
So someone with, say, 120 expansions total will have about 740 of their base Spire SS attributed to expansions. But someone with 149 expansions will have 800 points higher Spire SS than that just because of more expansions.
Updated Model
And here is the Iteration 2 model for end-game scenarios:
SSo = 6.90*AWL + FTotalExpansionCost(Exps) – 1100
where
- SSo – own base Spire squad size (first encounter)
- AWL – total AW levels
- Exps – total number of placed expansions (including starting ones)
As you can see, it is not that much different from Iteration 1. We still use the same two underlying variables. The big difference is that instead of fixed 25 coefficient for Exps, we now use a more elaborate function as outlined above. With that, we also had to recalculate AWL coefficient and the residual.
Model Accuracy
Alright! Let’s see if we did better than Iteration 1 😉 So here is a chart of actual vs predicted base Spire squad size for all these 49 scenarios:
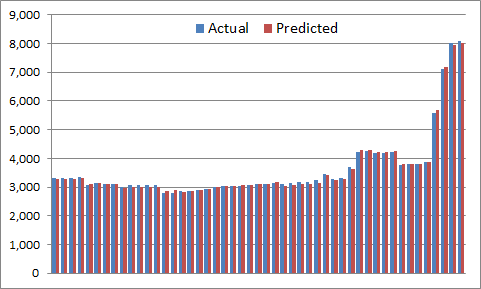
Now we have squad sizes vary within the 2.5-8K range, and fit seems to be better now. Let’s look at the differences (weird scale is to match the scale of differences for Iteration 1 in the first section):
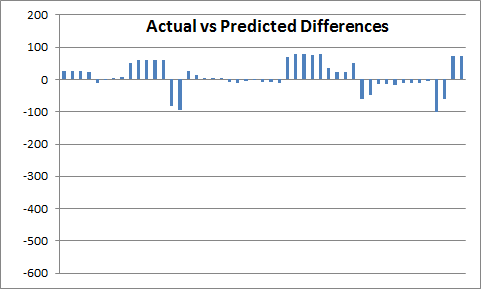
Nice! So we’re within 100 points differences across the whole spectrum, and mostly within 50. This is definitely an improvement vs Iteration 1. More importantly, this model matches observed incremental differences for additional expansions, where previous model… did not always do 😉
Interpretation
So, is it success then? Well, yes and no 😉 It is the same disclaimer as for Iteration 1. Let’s talk about what does all this mean, and how to interpret the results. So let’s put it right out there. Is the formula above a correct formula for Spire squad size calculation? The answer to that is NO again 😉 Let me explain why.
At the very least, I can assure you that this formula certainly does not work for non-end-game scenarios. At the very least this means that this fudge 1100 number at the end is actually a bunch of other variables – they just so happen to have the same or similar values for end-game players right now.
Even for end-game the formula is not guaranteed to be accurate, or even include all the right factors. We’ll keep monitoring new data and see if it still lines up. I’ll also be looking at some more extreme examples (much higher AW levels / provinces / expansions than common). We’ll see if it still works on those outliers. So again, send me more data! 😉
Incremental View
Another way to look at the model above is in incremental terms. What it tells you that for each 1 AW levels you’d be gaining 6.9 base Spire squad size on average. The incremental cost of expansions is more complicated, and you can see it described in a separate section above. Now if we assume that this simplified model is actually a variant of the full model, then that would mean that these incremental relationships would still hold for non-end-game cases. Expansion cost model was developed using data from non-end-game cases already, so that should work across the board. We’ll see if that truly is the case.
Conclusion
So again, while the model above is certainly not correct (again), it still can be quite useful. I mean, we know that Newton’s mechanics is technically not correct (as it doesn’t account for relativity). And yet for most practical reasons it is good enough. So far our Iteration 2 model is a pretty good fit (again!) for the end-game scenarios 😉
I am certain we will revisit this when we’ll get more data.


![Read more about the article Elvenar Woodelves – Day 21 [63%]](https://minmaxgame.com/wp-content/uploads/2019/03/WoodelvesFeaturedD21-300x113.png)
![Read more about the article Elvenar – Manual Fighting – Dust Tournament – 2019-01-03 [Thor]](https://minmaxgame.com/wp-content/uploads/2019/04/Emf-2019-01-03-dust-300x113.png)
![Read more about the article Elvenar – Spire Tutorial – Chapter 4 [Level 3]](https://minmaxgame.com/wp-content/uploads/2020/04/SpireRequirementsFeatured-300x113.png)
![Read more about the article Elvenar Sorcerers & Dragons – Day 27 [78%]](https://minmaxgame.com/wp-content/uploads/2019/04/SDFeaturedD27-300x113.png)
![Read more about the article Elvenar Sorcerers & Dragons – Day 29 [81%]](https://minmaxgame.com/wp-content/uploads/2019/04/SDFeaturedD29-300x113.png)
![Read more about the article Elvenar Woodelves – Day 19 [59%]](https://minmaxgame.com/wp-content/uploads/2019/03/WoodelvesFeaturedD19-300x113.png)