
This post is an extension of the main Model v2.1 article. Here we analyze in more detail the impact that leveling Ancient Wonders has on the Spire squad size calculation. I assume that you’ve read the main post (and have done so recently 😉 ). So if you haven’t read it, please go and read it before continuing. Without that, this post will make little sense 😉
Table of Contents
* – * – *
Model v2.1 – Ancient Wonders
Data
Here is a snapshot of data relevant for Ancient Wonders level impact analysis on the Spire squad size. You may want to click on the image to see a higher-resolution version. Don’t worry, I’ll explain what it all means 😉
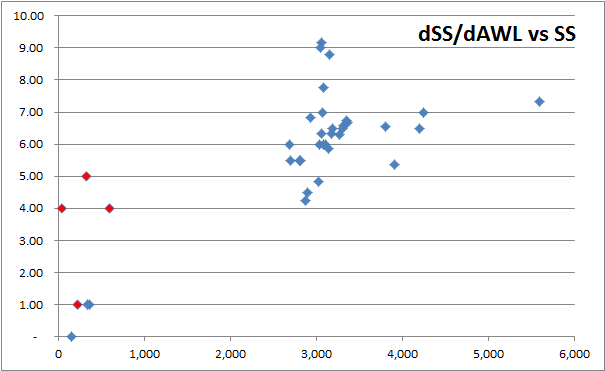
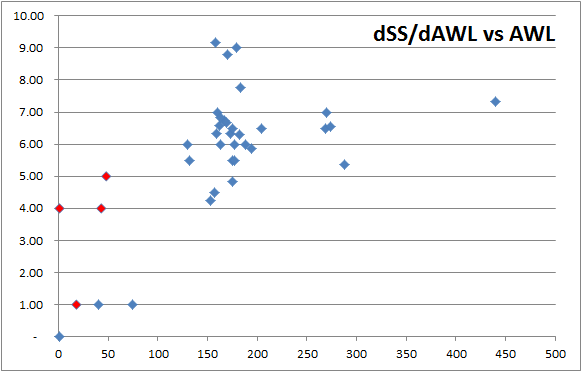
On the first chart here, X axis is a base Spire SS, while Y axis is an incremental increase to the base Spire SS when 1 AW level is added. The second chart is similar, but X axis is a total number of AW levels. You will see some red and blue dots here. Blue ones are relatively clean datapoints; red ones, on the other hand, are not. Basically, red ones are deduced from datapoints where several other things other than AW levels changed, and some of the assumptions used are pretty questionable. Red ones should generally be ignored as long as we have enough blue ones.
Now, even though it looks like there are a lot of good (blue) datapoints here, most are not quite uniform. Almost all are derived from results when several AW levels were added, and that means we could be adding apples and oranges together. Look at some of the potential factors below.
Classification
Unlike expansions where most of them are really indistinguishable – perhaps with a distinction of premium/map/research – AWs have a number of different factors that may impact their contribution to Spire SS. Here are some of them:
- Individual AW Level – each level can add different number of points
- Individual AW Chapter – e.g. Golden Abyss is from chapter 2, and Timewarp is from chapter 14
- Size – footprint might be a factor (e.g. GA is 3×3=9, and MM is 5×5=25)
- KPs – amount of KPs required to complete a particular AW level
- Relics – amount of Relics required to complete a particular AW level
This list is not exhaustive, but you can tell that there could be a LOT of differences in AW upgrades. In addition to that any individual AW can have their own profile, e.g. GA may have its own, Timewarp may have its own etc. This does not has to be connected with their size, or KPs or anything else.
Unfortunately, the data that we collected so far only focused on total number of AW levels, so any of the previous data won’t help us to figure out if any of these factors are relevant. Now I am started to collect much more granular data as far as Ancient Wonders are concerned, so we’ll see if we can see any dependencies in contributions to Spire squad size. But we’re certainly not there yet.
Insights
As you can probably tell, we have the most datapoints in the AW category, by far. This is due to the fact that for the most part, the end game cities have not much else to do outside of leveling their AWs. For other cities any AW level impact is usually conflated with research, and sometimes with other things.
Unfortunately, this also means that most of these datapoints are from similar cities in the end game. And for the most part, incremental cost of extra AW levels – on average – landed in 6-7 points range pretty reliably. So for Iteration 2 model the constant cost of AW levels worked pretty well. But now looking at some additional data from the very small cities this assumption is likely incorrect.
As you can see in the charts above, in really small cities extra AW levels add 0-4 points, and that’s it. Yep, there is even zero there, even though this is likely due to rounding. So with that, it is fairly certain that contributions of extra AW levels are not constant, but looking at the charts it is hard to tell if there is any obvious pattern to it.
Relatively certain conclusions
So what does this data tells us so far? Well, here are the things that we’re pretty certain about:
- Additional AW levels impact Spire SS positively
- i.e. each extra AW level adds something to your Spire squad size
- Only upgraded AWs count
- if you just contribute KPs (up to the max), but don’t actually upgrade, then it won’t change your Spire SS; I have tested it with several AWs
- Additional AW upgrades contribute to your Spire squad size different amounts
- Observed increments were within 0-9 range, so reasonably wide
Now on the differences in AW contributions. When I mostly looked at end-game cities, most of the increments were within 6-7 range, and those differences can be explained by rounding, data collection issues etc. But now when I can see 0-4 points per AW level in smaller cities, that hypothesis is highly unlikely to be true.
Speculations
OK, now let’s speculate on some things 😉 We may not have enough data to be reasonably certain about any of those, but some may be more likely than others. So here we go.
Contributed KPs as a driver of contributions
- [Highly Unlikely]
- We do have contributed KPs as a driver in other parts of the game (ranking points calc), that’s why I added it. But I am pretty certain that we have a few datapoints now where incremental AW level is L1, L6, L11 etc. And those levels require no KPs (and generate no ranking points), but Spire SS still goes up
Used relics as a driver of contributions
- [Highly Unlikely]
- Similar to the above, AW levels L1, L6, L11 require no relics, but Spire SS still goes up
Level or Size as a sole driver of contributions
- [Unlikely]
- I have at least one datapoint where a single EE upgrade to L23 only added 1 point to SS. This is a pretty high level upgrade, and a relatively sizable AW (5×4=20), so if just level or size would be a sole driver of the contributions I would expect much higher increment. This is a small city though (base SS is ~360), so that’s likely a culprit.
Variability of contributions
Now, the point about varying contributions is interesting. While it is quite obvious that this is the case, the reasons for that are not clear yet. Unlike the case with the expansions, it doesn’t seem that we have an obvious pattern here. The dependency on the level of the city (e.g. base Spire SS itself, and total number of AW levels), as depicted in the charts above, doesn’t tell a convincing story. In particular, you can see that over fairly large jumps in both base Spire SS (3K-5.5K) and total AW levels (150-450) we see very similar per-level increments (6-7). This makes dependency on any of these variables highly questionable (or course, it could be non-linear, but that would complicates things even more).
One explanation for this behavior could be dependency on the chapter / Main Hall level. This would make sense as then low level cities will still have low multipliers, but all higher level cities would have the same multiplier (leading to similar increments despite other differences). Unfortunately, this is also now unlikely. The reason for that is that if we would have had chapter as a multiplier on anything AW related, we would expect much bigger jump in Spire SS for people who just moved into chapter 16. 16 over 15 is almost a 7% increase, and we haven’t seen dramatic increases in base Spire SS due to simply entering chapter 16.
It is also quite possible that rounding has an impact on observations here, given that a single AW level increment is relatively small. We may expect to see some jitter in values, which doesn’t help with the analysis.
Possible Experiments
OK, so here are some possible experiments here. We can take 2 different AWs and start upgrading these by 1 level each, separately. Ideally, these would be as similar to each other as we can make them – e.g. same size and same starting levels. All that while doing no other changes. We should be getting almost exactly the same numbers for increments. If not, that would be an indication of either specific AW having a different profile, or that rounding has quite significant impact on the individual results here.
After we get some confirmation of the above, we can do something very similar. But instead, we get AWs very different in size (e.g. Abyss vs Maze), and still the same levels. This should clarify size impact.
Another experiment would be to run 1 upgrade a week at a time for a single AW, keeping everything else constant. Observed increments should clarify dependency on AW levels. This might be tricky to detect over small number of levels if variability is relatively small. This may require a longer stretch of upgrades.
We can also compare incremental results from leveling exactly the same AW to the exact same levels in several different cities (and perhaps doing it several times in a row). The differences should only depend on differences between cities themselves. Depending on the cities involved, we should be able to see if different things have any impact – chapter, MH level, total AW levels etc. There is a whole group of experiments right there. Again, could be tricky if there is a lot of noise in the observations.
In any case, if you have a city (or know someone 😉 ) like that, I’d like to hear from you! Either in comments, PM, or on US forums. It’s for science! 😉
Conclusion
And that’s it for now. We’ll need to wait for additional datapoints, and see if they can shed some additional light on what is going on with Ancient Wonders impact on the Spire squad size. So if you have a city where you can run some of the experiments outlined above – consider freezing that city for some time (in terms of unlocking research, placing the expansions etc) to record data for this experiment. Let me know if you need any assistance with that.
I am certain we will revisit this when we’ll get more data.

![Read more about the article Elvenar Woodelves – Day 15 [46%]](https://minmaxgame.com/wp-content/uploads/2019/03/WoodelvesFeaturedD15.webp)
![Read more about the article Elvenar Sorcerers & Dragons – Day 26 [77%]](https://minmaxgame.com/wp-content/uploads/2019/04/SDFeaturedD26.webp)

![Read more about the article Elvenar Woodelves – Day 28 [82%]](https://minmaxgame.com/wp-content/uploads/2019/03/WoodelvesFeaturedD28.webp)
![Read more about the article Elvenar – Tournament Tutorial [2020] – Steel](https://minmaxgame.com/wp-content/uploads/2020/08/Ett-steel.webp)