
So it is time to do another fun data project – probabilities analysis for Elvenar crafting recipes. Basically, we want to find out what are the chances for different recipes to pop up in the Magic Academy where you can craft them. Are they all the same, or are there differences?
Table of Contents
* – * – *
Some time ago, we’ve put together a complete list of all available crafting recipes in Elvenar. The recipes that may be available for crafting in the Magic Academy. The list is available right here:
The information on existing recipes is complete and accurate as of the time of this writing. We periodically update this, so it should stay current. And when we say accurate, this means to the extent possible – as some data is crowdsourced.
Why?
With that out of the way, let’s talk about why we have started this crafting recipes probabilities analysis. For a long time, an assumption was that all recipes have equal probability of showing up in the MA. There was no real basis for that assumption except that it is easy to implement and there are no obvious reasons to attach different probabilities to different crafting recipes. All short-term imbalances could be written off as anecdotal evidence. These could also be explained by natural variability that is expected with over 100+ different recipes. No one did run a consistent recipe data collection to see if uniform hypothesis makes sense.
Until recently. One of the players started to collect recipe data, and was doing it consistently for some time now. And even initial data set did not look like it was coming from the setup where all crafting recipes have equal probabilities.
So that piqued my interest. So what are the probabilities of different crafting recipes popping up in the MA? What are the patterns that we can find using limited data? That’s what this project is all about.
Assumptions
Alright, before we go further let’s just clarify some of the assumptions here. First of all, we know for a fact that ultimately probabilities are specific to each player. A trivial example of that would be craftable one-off buildings, such as one of the Chess set pieces. The probability of such recipe showing up is zero for players who already have it, and non-zero for those who do not. So different players would have different recipes available to them just because of that.
Then there is a chance that some of the recipes as seasonal, so they show up in certain periods, and then they don’t. Others are still just temporary. But stripping all of the above, we can take a look at a core set of recipes which are available to everyone at all times. It just so happens that that’s 80 recipes at the moment. We will be looking at probabilities of these core recipes in the analysis.
Keep in mind that probabilities that we will be working with here are not absolute. If we come up with 1% chance for one of the core recipes it does not mean that we expect to see it on average every 100 recipes that we see in the MA. We expect this particular recipe to be 1:100 of all the core crafting recipes that we observe, so effectively these are conditional probabilities. The question of how core recipes are related to non-core is still open. This will need a lot more data – simply because non-core recipes are different for different players. This is a problem for another time 😉
Caveat
Also, we will assume here that at least all core crafting recipes have fixed probabilities of showing up. And these probabilities do not change with time, city setup etc. Basically, we assume that distributions are stable. This is an assumption, but a fairly reasonable one. It is possible that there is some manipulation of the underlying distributions going on, but this would make the whole mechanics quite a bit more complicated, and so far we have no particular evidence of that. But this is still a possibility which may invalidate a lot of the results here.
Analysis
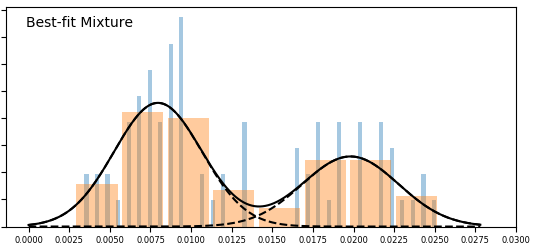
Now with that out of the way, let’s look at the data. So this is how histogram of the initial data set looked like (at ~500 observations):
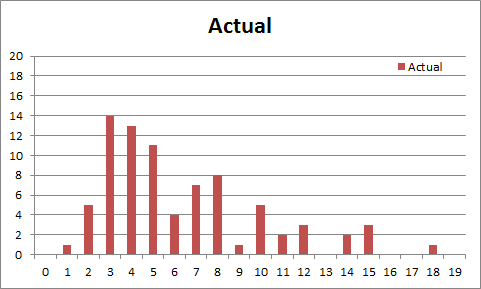
Hmm, not exactly what you’d want to see for uniform distribution. If all core recipes have the same probability, then each one would have 1.25% chance of popping up. With 500 observations we should be seeing something like a typical bell curve centered around 6. This does not look particularly convincing, and it only went down from there.
Not uniform?
But what would we expect to see if we abandon the idea that all recipes have the same chance of showing up? Well, with more data (vastly more than we can hope to accumulate in any reasonable time) we would expect to see as many peaks on the histogram as there are distinct probabilities in the recipe set. You can think of that as all core recipes being assigned to one of the M pools, and recipes in each pool have the same probability (but different from all other pools). Then we would expect to see M peaks on the histogram – eventually. Uniform hypothesis in this context is simply a 1 pool setup.
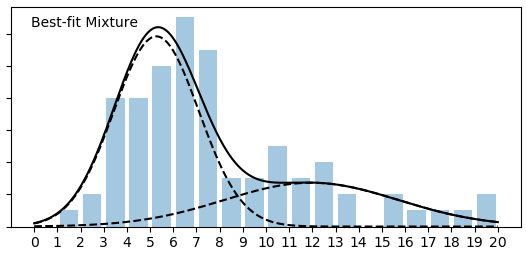
So the histogram above doesn’t look like an obvious single peak, but it doesn’t look obviously multi-modal (multiple peak) either. We needed more data! With more data I expected us to either converge to a single mode (confirming a uniform hypothesis), or start seeing distinct peaks on the histogram. That would indicate that we have several groups with different probabilities. Something like this:

There are ways to try to fit such mixtures to observed distribution, and assess how many components (pools) there likely are. And that’s what I’ve been trying to do with our increasing data set (I also added 2 more cities to that).
Even with the data above, it turns out that 2-pool model is a better fit than 1-pool already. There is no data yet that would suggest that 3-pool looks better either.
Evolution
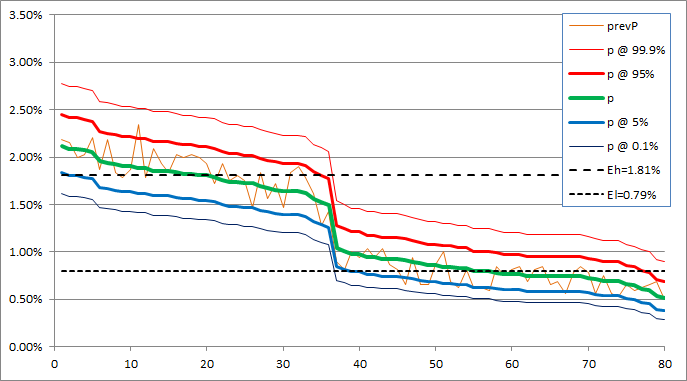
With more data, we get better definitions for the underlying pools. This is how it went:
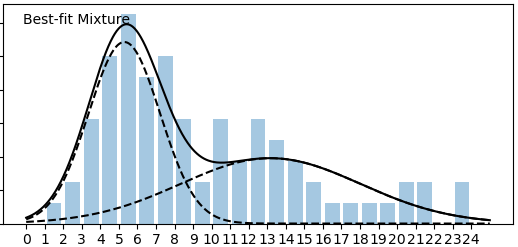
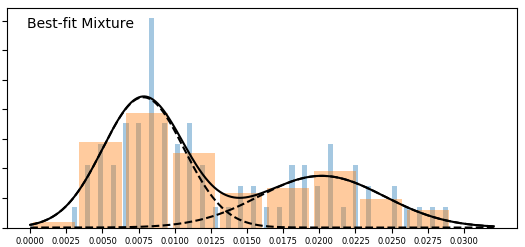
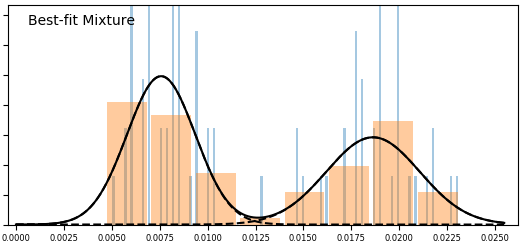
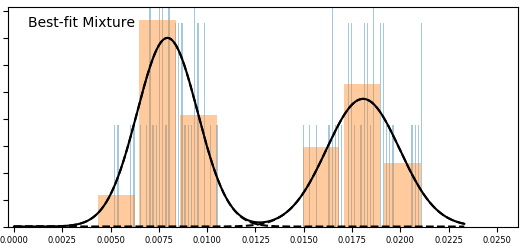
So just as anticipated, with more data distributions for individual components (pools) get tighter. In the latest version they finally pretty much completely separated – there is almost no overlap there. The single pool (uniform) hypothesis looks extremely unlikely, but more components (pools) than 2 do not actually improve the fit enough to make this a plausible hypothesis at this time.
Insights
So, what does this mean? A few things:
- Hypothesis of all core recipes having the same probability is pretty much off the table
- There are at least two different probabilities attached to core recipes, making for at least two substantially different pools – H (higher) and L (lower)
- Just because we can’t justify additional pools just yet, doesn’t mean that there aren’t more! We may not have enough data just yet. So between any two recipes in the same pool (H or L) we cannot say yet whether they have the same or different probabilities.
- But what we can say is that the chance of any two recipes from different pools having the same probability are very, very low. E.g. there are at least 2 distinct pools).
Here are some stats for both pools so far:
L | H | Total | |
|---|---|---|---|
| N | 44 | 36 | 80 |
| Obs | 2,111 | 3,930 | 6,041 |
| Mean | 0.79% | 1.81% | 1.25% |

And here are more details for individual core recipes. OK, those certainty numbers look very optimistic in absolute sense, but you can see which ones are still on the fence (less than 100%):
id | Obs | Freq | Pool | Certainty | Recipe |
|---|---|---|---|---|---|
| 2 | 116 | 1.92% | H | 100.00% | 6-Time Booster 10min |
| 3 | 102 | 1.69% | H | 100.00% | 9-Time Booster 15min |
| 16 | 126 | 2.09% | H | 100.00% | 1-Supply Windfall 33% |
| 18 | 94 | 1.56% | H | 100.00% | 1-Supply Windfall 100% |
| 23 | 115 | 1.90% | H | 100.00% | 1-Coin Rain 25% |
| 24 | 90 | 1.49% | H | 100.00% | 1-Coin Rain 33% |
| 25 | 105 | 1.74% | H | 100.00% | 1-Coin Rain 50% |
| 26 | 112 | 1.85% | H | 100.00% | 1-Coin Rain 100% |
| 27 | 118 | 1.95% | H | 100.00% | 2-Ancient Knowledge 3 |
| 28 | 117 | 1.94% | H | 100.00% | 2-Ancient Knowledge 5 |
| 33 | 125 | 2.07% | H | 100.00% | 1-Magical Manufacturing |
| 34 | 98 | 1.62% | H | 100.00% | 2-Power of Provision |
| 35 | 114 | 1.89% | H | 100.00% | 1-Ensorcelled Endowment |
| 36 | 124 | 2.05% | H | 100.00% | 3-Inspiring Meditation |
| 37 | 109 | 1.80% | H | 100.00% | 5-Gems Relic |
| 38 | 114 | 1.89% | H | 100.00% | 5-Dust Relic |
| 39 | 128 | 2.12% | H | 100.00% | 5-Elixir Relic |
| 40 | 92 | 1.52% | H | 100.00% | 5-Silk Relic |
| 41 | 99 | 1.64% | H | 100.00% | 5-Scrolls Relic |
| 42 | 100 | 1.66% | H | 100.00% | 5-Crystal Relic |
| 43 | 127 | 2.10% | H | 100.00% | 5-Planks Relic |
| 44 | 99 | 1.64% | H | 100.00% | 5-Steel Relic |
| 45 | 110 | 1.82% | H | 100.00% | 5-Marble Relic |
| 46 | 115 | 1.90% | H | 100.00% | 1-Silver Unicorn |
| 47 | 99 | 1.64% | H | 100.00% | 1-Crystal Unicorn |
| 50 | 108 | 1.79% | H | 100.00% | 1-Lava Codex |
| 56 | 109 | 1.80% | H | 100.00% | 1-KP |
| 57 | 101 | 1.67% | H | 100.00% | 3-KP |
| 89 | 111 | 1.84% | H | 100.00% | 10-Royal Restoration |
| 92 | 104 | 1.72% | H | 100.00% | 1-Ancient Knowledge 3 |
| 96 | 106 | 1.75% | H | 100.00% | 1-Pet Food |
| 97 | 105 | 1.74% | H | 100.00% | 1-Pet Food |
| 98 | 104 | 1.72% | H | 100.00% | 1-Pet Food |
| 105 | 112 | 1.85% | H | 100.00% | 1-Supply Windfall 15% |
| 106 | 110 | 1.82% | H | 100.00% | 1-Supply Windfall 25% |
| 107 | 112 | 1.85% | H | 100.00% | 1-Supply Windfall 50% |
| 1 | 45 | 0.74% | L | 100.00% | 1-Portal Profit 5% |
| 4 | 56 | 0.93% | L | 100.00% | 5-Time Booster 30min |
| 5 | 43 | 0.71% | L | 100.00% | 5-Time Booster 45min |
| 6 | 48 | 0.79% | L | 100.00% | 7-Time Booster 1h |
| 7 | 52 | 0.86% | L | 100.00% | 4-Time Booster 2h |
| 8 | 45 | 0.74% | L | 100.00% | 1-Time Booster 5h |
| 9 | 46 | 0.76% | L | 100.00% | 1-Time Booster 8h |
| 10 | 41 | 0.68% | L | 100.00% | 1-Time Booster 14h |
| 11 | 50 | 0.83% | L | 100.00% | 1-Supply Windfall 5% |
| 12 | 46 | 0.76% | L | 100.00% | 1-Supply Windfall 10% |
| 14 | 53 | 0.88% | L | 100.00% | 1-Supply Windfall 20% |
| 29 | 45 | 0.74% | L | 100.00% | 1-Ancient Knowledge 7 |
| 30 | 54 | 0.89% | L | 100.00% | 1-Ancient Knowledge 10 |
| 31 | 42 | 0.70% | L | 100.00% | 1-Ancient Knowledge 15 |
| 32 | 46 | 0.76% | L | 100.00% | 1-Ancient Knowledge 20 |
| 54 | 39 | 0.65% | L | 100.00% | 1-Rainbow Flower Cage |
| 58 | 44 | 0.73% | L | 100.00% | 6-KP |
| 59 | 46 | 0.76% | L | 100.00% | 10-KP |
| 60 | 45 | 0.74% | L | 100.00% | 15-KP |
| 61 | 48 | 0.79% | L | 100.00% | 1-Rainbow Unicorn |
| 70 | 37 | 0.61% | L | 100.00% | 1-Broken Shards |
| 71 | 51 | 0.84% | L | 100.00% | 2-Broken Shards |
| 72 | 52 | 0.86% | L | 100.00% | 3-Broken Shards |
| 73 | 56 | 0.93% | L | 100.00% | 1-Magnificent Mage Multiplier |
| 74 | 45 | 0.74% | L | 100.00% | 1-Unleashed Unit Upgrade |
| 75 | 57 | 0.94% | L | 100.00% | 1-Enlightened Light Range |
| 76 | 63 | 1.04% | L | 99.90% | 1-Grounds of the Orc Strategist |
| 77 | 57 | 0.94% | L | 100.00% | 1-Orc Nest |
| 78 | 36 | 0.60% | L | 100.00% | 1-Vallorian Valor |
| 79 | 31 | 0.51% | L | 100.00% | 1-Mana Sawmill |
| 80 | 45 | 0.74% | L | 100.00% | 1-Traveling Merchant I |
| 81 | 48 | 0.79% | L | 100.00% | 1-Traveling Merchant II |
| 82 | 32 | 0.53% | L | 100.00% | 1-Traveling Merchant III |
| 83 | 56 | 0.93% | L | 100.00% | 1-Portal Profit 10% |
| 84 | 47 | 0.78% | L | 100.00% | 1-Portal Profit 15% |
| 90 | 59 | 0.98% | L | 100.00% | 20-Royal Restoration |
| 91 | 61 | 1.01% | L | 100.00% | 30-Royal Restoration |
| 93 | 45 | 0.74% | L | 100.00% | 1-Ancient Knowledge 10 |
| 94 | 50 | 0.83% | L | 100.00% | 1-Ancient Knowledge 15 |
| 104 | 42 | 0.70% | L | 100.00% | 1-Festival Merchant |
| 113 | 51 | 0.84% | L | 100.00% | 30-Royal Restoration |
| 114 | 42 | 0.70% | L | 100.00% | 1-Portal Profit 20% |
| 115 | 55 | 0.91% | L | 100.00% | 1-Time Booster 20h |
| 116 | 59 | 0.98% | L | 100.00% | 1-Pet Food |
Conclusion
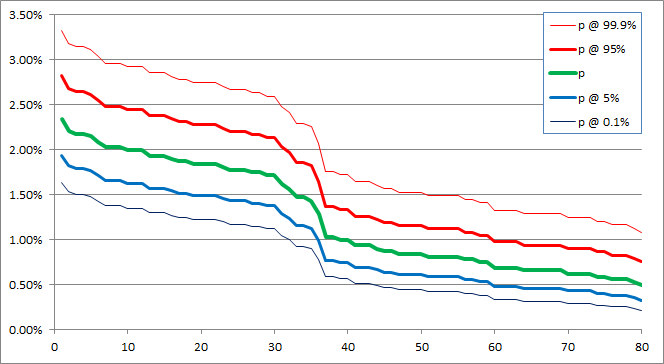
So, where do we go from here? We’ll keep accumulating data, and see how observed frequencies shape up. Unfortunately, any further insights may take a long time to develop. The thing is, standard deviation in our observations should grow as a square root of number of observations. This means that in order to improve accuracy by a factor of 2x, we need 4x more observations. For 10x the accuracy we need 100x more observations etc. So if at ~3000 observations now we can place L mean to be within 0.25% to 1.25% (so ~1% range), then to make this range ~0.5% we need about 10,000 more observations etc.
And if there are other sub-pools within H and L then it will likely require even more data so that we can split these sub-pools cleanly. As I said, this may require a lot more data, and it is hard to collect manually.
On the other hand, with more data we may be able to get more insights from tightening confidence intervals rather than continue with mixture of normals. See the chart above – once we start seeing some areas where lower bound is higher than upper bound, then we will be able to split more pools. If there are any, that is.
So we’ll see how it goes. We’ll slowly accumulate more data and we’ll see if there are any new and/or different patterns emerge. Stay tuned!

![Read more about the article Elvenar Woodelves – Day 13 [40%]](https://minmaxgame.com/wp-content/uploads/2019/03/WoodelvesFeaturedD13.webp)
![Read more about the article Elvenar – Tournament Tutorial [2020] – Silk](https://minmaxgame.com/wp-content/uploads/2020/07/Ett-silk.webp)
![Read more about the article Elvenar Woodelves – Day 04 [14%]](https://minmaxgame.com/wp-content/uploads/2019/03/WoodelvesFeaturedD04.webp)
![Read more about the article Elvenar Halflings – Day 01 [08%]](https://minmaxgame.com/wp-content/uploads/2019/06/HalflingsFeaturedD01.webp)
![Read more about the article Elvenar – Advanced Spire Tutorial [Level 1]](https://minmaxgame.com/wp-content/uploads/2020/04/SpireRequirementsFeatured.webp)
![Read more about the article Elvenar Sorcerers & Dragons – Day 05 [20%]](https://minmaxgame.com/wp-content/uploads/2019/04/SDFeaturedD05.webp)
Unfortunately I don´t have the link, but it had been confirmed a while ago by someone official (maybe a Forum mod? possibly in an update announcement?) that not all are equal probability. Of course that does not guarantee 100% certainty either (especially if it wasn´t an announcement), but it was good enough for me to operate on the assumption that there were different probabilities. Nothing more than that though, so nothing on how many pools or what the difference in probability is.
There was a comment like that from a mod on French forums, perhaps elsewhere as well. But I tend to discount these. With respect to the underlying game mechanics, mods on the forums have been wrong before 😉
I was under the impression that there are 5 pools. One for each “slot” and that’s why you never see 2 pet foods at the same time for example.
I do see that this post is from June though so maybe it changed to 5 pools after that?
That’s right, they switched to 5 independent slots setup sometime around July IIRC. This change invalidated all the previous collections, and now we need to get so much more data as there are 5 individual buckets. But the data that I’ve got so far strongly suggests that even within the new slots chances of different recipes are NOT equal.
Damn. All I was really after was a really rough answer to
“How many UUU per year is I keep that slot clear and check it 4x per day?”
Can you still ballpark that? Maybe with an assumption that no recipe is more than twice as likely as another?
That would be about 80.