
[2020-08-26] City Advancement Level Model (CAL Model) takes different parameters that developers consider relevant for city development (e.g. relics boost, research, AW levels and expansions) and bakes all of them into a single CAL number. This number represents city advancement level (duh!) the way the game sees it. I.e. if you have a higher CAL number, your squad sizes and catering costs for the same encounters will be higher in both Spire and the tournaments. Literally all size/amount parameters in the Spire and tournaments for any particular encounter are determined by this single number. So let’s see how it works.
Table of Contents
* – * – *
Previous Work
People familiar with modeling done for the Spire Squad Size will recognize a lot of the same material here. Indeed, CAL is a generalization of the same concept that we used heavily in SSS Models. Except that now everything is not pinned to the base Spire Squad Size, but instead to the CAL. CAL is not unique to the Spire (unlike SSS), and is shared between Spire and the tournaments.
As such, you will find a lot of similarities between this model and SSS Model v5.0. So if you’ve read that post, you should be quite comfortable with what is described in the CAL model.
City Advancement Level Model
So why do we need a new model, and a whole new internal parameter? There are a few reasons. One is that this is how the game seems to model things internally. But other reasons are more important.
We could have used SSS as CAL-type parameters – we did just that for the Spire. But Spire is only available starting from chapter 3, so SSS is not observable for the first 2 chapters. But tournaments are accessible from the very beginning, and our model should account for that.
We could have used base tournament SS (TSS) as our CAL-type parameter, but it is not yet widely observable (only on Beta and EN servers at this moment). Also, TSS numbers are quite a bit smaller in scale, so potential modeling errors would be higher. And if we switch to TSS, we’d have to redo Spire calculation anyway (using TSS).
So CAL it is. This number by itself has little meaning until you convert it into Spire and/or tournament data (unless you can observe it directly). Good news is that SSS Model v5.0 is not becoming obsolete per se – it turns out, that this City Advancement Level Model is just a more general model, and SSS Model v5.0 can be easily transcribed using CAL. We’ll discuss this in more detail down below.
Underlying Variables
Before we get to the formula, we need to talk about what are the underlying variables used there. So here are the variables that we used:
- maxB – maximum unlocked boost percentage for T1/T2/T3 goods
- M – total number of unlocked mandatory tech items (research)
- A – total number of AW levels (including currently upgrading)
- V – number of placed non-premium expansions (including initial 6)
- P – number of placed premium expansions
All these definitions stay the same as in SSS Model v5.0.
maxB
maxB is a maximum percentage of relic boosts for T1, T2 and T3 goods. If T3 boost is not unlocked yet, then maxB is the maximum boost for T1 and T2 goods only (even if you have a ton of T3 boosted relics). You can see your relic boosts on the Relics tab of the Main Hall. As an example, if your boosts are at 381%/557%/433%, then your maxB is 557%.
It is hard to say whether we should include Mountain Halls boost here or not, but this question is purely academic. By the time one can unlock and build Mountain Halls, pretty much every city would have their relic boosts maxed out. I don’t expect to find any use cases where Mountain Halls boost applies to less than max base boost, but if you have data on such a city let me know, we may only need a single observation to figure out the difference.
M
I probably need to clarify what I mean by mandatory tech items. In this context it is simply tech items that have dependent nodes. So if a research item doesn’t have any children, then unlocking it doesn’t impact CAL – meaning there is absolutely no impact on the Spire and/or tournaments. We’ll discuss it in more detail in the insights section.
And that’s it, just these 5 parameters can explain the variance in the base values for the Spire and the tournaments pretty well. As usual, with the data collected so far 😉
SSS Formula v5.0
As you may remember, SSS v5.0 formula looks like this:

We can rewrite it in a slightly different form:

These formulas are not exactly the same, but for the vast majority of the cities the differences are within rounding error.
CAL Formula
If you’ve seen Spire Progression Model, you know that SSSo = 0.58 * CAL. This means that CAL = SSSo / 0.58, or simply this:

[2020-08-26] Well, this is how CAL formula looked like at the time SSS Model v5.0 was valid. But since that time CAL formula was adjusted, and as of 2020-08-26 it looks like this:

Changes vs Previous Version
So as you can see, expansion cost became cheaper. Regular expansions are about 10% cheaper now, and premium expansions are slightly more than 20% cheaper than before. However, research became more expensive (a single research increases CAL by 0.45% instead of 0.42% previously).
Alternatively, we can refactor and write the same 2020-08-26 formula like this:

This way you can see that premium expansions now cost about 66% of the regular ones. Previously, it was 75%.
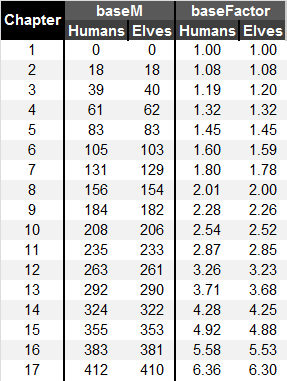
And here is a graphical representation of the changes:

Well, this explains a lot. The table on the left represents changes in the expansion factor, and the table on the right is a change in the research factor (for Human cities). As you can see, in the vast majority of cases reduction in the expansion term is from 11% up to 14-15%. And what do you know? If you’re at the end of chapter 16 (so chapter 17 in the table), your research term will increase by 13% for the net result of about no change. Which many end-game players confirmed. Early chapters got a benefit, which will evaporate when they progress through the chapters. And you do know what is going to happen if we project these changes into chapters 17+, right? 😉
Model Accuracy
Unlike the previous modeling of Spire SS (CAL predecessor), I don’t intend to make it super accurate. The reason I wanted to do that for Spire SS is to make sure that the functional form of the calculation is correct. But this also meant that I had to do a lot of data cleanup. I mean, A LOT. Now, when we are reasonably certain that functional form is correct (assuming it is the same), there is no reason to shoot for sub-1 accuracy. Errors of several points for base squad sizes are perfectly fine for all practical purposes, and it allows for much faster model updates. As long as there are no systematic drifts (indicating potential changes to functional form) this would work just fine.
CAL is not easily observable by itself, so we’ll have to compare forecast Spire and tournament SS numbers with the actual results. Once I have enough clean data I will post those comparisons here, so watch this space. But let’s just say that updated CAL model is good enough for all practical purposes, and it certainly works better than v5.0 on the current data.
Insights
So, is this formula how new squad sizes and catering costs are calculated for the Spire and tournaments? Probably close enough 😉 While it is not as accurate as previous v5.0 just yet, the errors across very different cities are small enough to be reasonable certain that the model captures most of the variance. Over time we may adjust some coefficients for the better fit – when we get more clean data.
As usual, format of the formula might be different (different factorization etc), but it has to be pretty much equivalent to what we have here. It is really hard to fit that many datapoints that closely just by accident 😉 And there are only 5 variables, they all make sense, the formula makes sense for something that is actually designed, and the fit is just too good on that many observations to be a fluke.
Model Makes Sense
As you may recall, accuracy of SSS Model v5.0 left little doubt that this is pretty much how SSSo was calculated. Well, new CAL model looks pretty much exactly the same, just with slightly adjusted coefficients. And it maintains a pretty good fit.
Just like with Model v5.0, I have also rounded coefficients in the CAL formula to make it more likely to be something designed. There are no super-weird coefficients here (e.g. super-sensitive 8-digit precision), and all look quite sensible. And the fit still is pretty good.
The formula also avoids negative and zero numbers, which can be a problem with factored formulas. Research term is an exponent, so always >1. AW component is also >= 1 even with zero AWs. Expansion term is >=1 as V is always at least 6 or more. Boost component is obviously positive. Again, all this makes sense, which is a very good sign.
Explains Changes Well
This model also doesn’t seem to exhibit error drift for individual cities, even for several weeks of observations. So it doesn’t match just individual observations, but it also matches changes with evolution of underlying parameters over many points in Spire and/or tournament changes. This is a very good thing, meaning that this model explains changes due to the observed parameters pretty well. We’ll still need more data to ascertain this, but so far it is looking pretty good.
Model Issues
Not necessarily an issue per se, but this model is not yet as accurate as Model v5.0 used to be. See accuracy disclaimer above – we may never get to the same level of accuracy here simply because this doesn’t gain us anything. But I expect to see a better fit as we collect more data (probably after the changes go live on multiple servers).
Another thing is so far I have seen almost no data for the tiniest of cities. Previously, the tiniest cities for SSS model were at least Chapter 3. Now we can model cities starting with literally day 1. And we already know that there are some special cases there (e.g. some kind of flooring when squad sizes are below 10 etc). None of that has been tested yet in this model. I don’t consider it to be super important 😉 But we’ll clean it up once – again – we’ll collect more data.
I’d say that the model is usable for the most cases, with possible exception of the cities at the edge of the low-end.
Interpretation
Now, with the usual disclaimer in place, let’s assume that our model is a real thing. What would that mean?
Multiplication
The fact that research term is a multiplier means that the same changes in other parameters lead to different changes in CAL. The more research you’ve done, the higher the impact. We can say the same about AW levels as that term is also a multiplier. Ditto for expansions. Relics boost component is slightly different as it is capped, so it can be assumed constant over the long term.
This behavior is certainly that we can see in actual data, so our model explains that.
Research
So the research term (1.0045M) is pretty easy to explain. It basically means that if other parameters stay the same, a single extra unlocked mandatory research will increase your base Spire squad size by 0.45%. That’s it 😉 The model is pretty sensitive to this coefficient, so it is almost certain that this is the right number (given that overall model is correct). Clean experiments also confirm this number.
This also means that amount of KPs in research doesn’t matter. Partially filled research doesn’t matter. Filled but not paid for research doesn’t matter. And research with no dependent nodes doesn’t matter. So from that perspective taking optional SSU techs won’t impact Spire SS at all. But it’s not just optional SSU – any optional research (expansions, culture etc) won’t have an impact.
One interesting observation is that the last research item in the tech tree doesn’t have any dependents, so from that perspective it does NOT count. And right now chapter 16 is the last chapter, and it has 3 final techs. Taking any of those does not change your Spire SS (matches observations so far).
This also means that when chapter 17 tech tree gets populated, some of these final techs may become mandatory automagically, even without doing anything in the city. We may see a jump to Spire SS for end-game cities when chapter 17 gets added (not when city starts playing chapter 17!)
NOTE: The above hypothesis has been confirmed as of 2020-08-26 as chapter 17 research is already somewhat populated, making the last 3 techs in chapter 16 mandatory.
M Values per Chapter
Another interesting thing about this approach is that everyone at the end of each chapter will have the same research multiplier, regardless of which optional techs you did or did not take before that. This also makes sense from the design perspective, so another argument for this being real. You can use the table below to get base M value for your chapter, and then add manually counted number of unlocked mandatory tech items from your current one:
Ancient Wonders
AW term is (0.003A+1), meaning that for every ~333 AW levels you get 1x CAL increase. E.g. if your CAL with no AWs whatsoever is 1x, then adding ~333 AW levels will double it to 2x, ~667 AW levels will triple it to 3x and 1000 AW levels will quadruple it to 4x. If you keep your research and expansions constant (e.g. end-game), then you will be adding the same points per AW level, on average. Given relationship of CAL with Spire and tournament numbers, you can replace CAL with any Spire or tournament output.
It also means that only total AW levels matter. Kind of AW does not matter. Specific size, level, KP contributions etc do not matter. AWs with KPs contributed but not upgraded do not count as an increase. This generally agrees with experimental observations (with some rounding noise on top).
Expansions
We can also see different coefficients for premium expansions (P) and non-premium expansions (V). This means that adding a single premium expansion increases your CAL less than adding a single non-premium expansion. Formulas above make it clear that adding 1 premium expansion will only add ~66% of CAL increase comparing to adding 1 non-premium expansion. We do see evidence of that in the data.
If you keep your research and AW levels constant, then you will be adding the same points per expansion kind (premium and non-premium differ).
Relics Boost
Relics boost component has a form of (min(maxB, 700%) + 1). maxB can vary from 0% to 700% (and perhaps more, if we take Mountain Hall boosts into consideration). But the min(maxB, 700%) term means that this is capped at 700%. Which basically means that once a single one of your T1/T2/T3 boosts reaches 700%, this whole term becomes a constant and does not change anymore, ever.
Basically, most cities do not need to worry about variability of this term. It is capped, and once this cap is reached it stays constant forevermore.
But more importantly, did you notice that there is a MinMax component in the formula? This is clearly a sign that this formula is finally the correct one! 😉
Regular Squad Size
Not a factor anymore! So players who did take optional SSUs are not penalized for that. Not in the Spire. And now not in the tournaments! Enough said 😉
Other variables
Nothing else has an impact on numerical parameters of Spire and tournaments. Moving up a chapter doesn’t matter outside of completion of another research item (confirmed experimentally). Main Hall upgrades do not matter (also confirmed experimentally). Number of relics past 500 does not matter.
Basically, all kinds of other things that were considered to have an impact do not actually matter.
CAL Calculator
There is a full Tournament and Spire Requirements Calculator in the main post here:
You can use it to see a full tournament and Spire requirements progression based on fundamental factors. And it does it by calculating CAL first, which you can see on CALCalc sheet.
Conclusion
So we did get a new CAL model, and as you can see it looks very similar to the previous Spire SS model. But now it is shared between Spire and tournament, and works well for both. We have also adjusted parameters to reflect changes that were introduced as part of the tuning for the new tournaments.
It still works well across the whole spectrum of cities. And predicted results match the observations fairly well. And it still makes sense 😉
More importantly, we uncovered that MinMax is still a part of the final formula. This is pretty much undeniable proof that it is correct. I think we might be done here! 😉
So you can already start playing with this formula and see if your city data fits. Most of the parameters are easy to observe, and the ones that are not are easily handled by the calculator posted above.
*-*-*
So that’s it for now. We’ll keep monitoring new data for some unexpected results, and potentially adjust coefficients for a better fit. Let me know in the comments if your city does or does not match well with the model forecast (for SSSo and/or TSSo). It would be particularly interesting if you see any significant deviations. But if your results are noticeably off from predictions, the first thing I would suggest is to check you input data. Research numbers are commonly done incorrectly, so double check that. AW levels also can be tricky as it seems that AWs that are still upgrading do count as completed for the CAL calculation – unlike, say, Trader bonus calculation where these would not. Also keep in mind as Spire and tournament start at different times, they may have different CALs baked in if there were any changes between Sunday and Tuesday.
I think that’s all there is to it 😉


![Read more about the article Elvenar Sorcerers & Dragons – Day 23 [63%]](https://minmaxgame.com/wp-content/uploads/2019/04/SDFeaturedD23.webp)
![Read more about the article Elvenar – Tournament Tutorial [2020] – Silk](https://minmaxgame.com/wp-content/uploads/2020/07/Ett-silk.webp)
![Read more about the article Elvenar Woodelves – Day 18 [58%]](https://minmaxgame.com/wp-content/uploads/2019/03/WoodelvesFeaturedD18.webp)
![Read more about the article Elvenar Orcs – Day 30 [78%]](https://minmaxgame.com/wp-content/uploads/2019/03/OrcsFeaturedD30.webp)
Instead of…
TSS = 0.1159 * CAL
SSS = 0.58 * CAL
CAL = 0.6887 * (non-random things)
…I think it would be easier (and much more how-a-programmer-would-do-it-y) to stay with SSS and a single factor:
SSS = 0.4 * (non-random things)
Wo do lose the CAL as an independent base for both spire and tournament, but we do not need an independent base anyway.
Why? Old tournament formula included the Province Squad Size:
TSS = PSS * 5%
Your calculated new TSS is extremely close to:
TSS = SSS / 5 = 4 * SSS * 5%
which makes a LOT of sense: Old PSS is replaced by new SSS, and 4 fights are clumped together into one.
I have mentioned in the post as to the reasons why. The game uses CAL internally, you can see it if you know where to look. And SSS does not exist for chapters 1 and 2. And we detach common factor changes from tournament and Spire specific changes.
.
Also, while SSS/TSS is very close to 5, it is not exactly that. On large numbers you can see the difference.
“Another thing is so far I have seen almost no data for the tiniest of cities.”
I have Chapter 2 city which I can provide data for, but do not know where or if this is still wanted or not. I am still learning and do understand many of the basics explained here … but not quite all since am still learning the more advanced details. Not even sure what all data I need to collect, but will record as much as I can prior to next Tournament start. Biggest thing is TSSo, SSSo, etc which really not understanding yet.
Anyway am in EN1 Arendyll server which I believe per my understanding this new formula is being tested at?
EN servers indeed have the new system already. TSSo and SSSo are very simple – these are your own squad sizes in the very first encounter in the tournaments and Spire respectively.
.
If you use the calculator linked in this post, you will see all the parameters needed for reporting, and given the formula should be close enough even for the small cities you should be able to see if you’ve got the right parameters right away.
Yes I got your calculator already. Ah Spire and Tourn, Ta! Looks like I did not explain myself well. I also wanted to know IF still needing and wanting data, where should I be reporting that?
Anyway I recorded all my city data prior to Tournament start and for first * province encounters. Took screenshots of it all and input data in calculator. However, if I am reading the TournamentCalc spread correctly and understanding it. I should only need to input my very first 1* province encounter in the orange field .. and then it should show me all my other provinces. IF that is the case, then it is not reflecting correctly. If however I change that orange field to my TSSo for each province, then yes it is roughly showing right parameters for what I seen. So Idk, maybe just not reading the calc correctly.
* – Own – E – Coin – Sply – T1
1* – 10 – 2 – 0 – 140 – 34 (17/17)
2* – 11 – 3 – 2700 – 0 – 68 (34/34)
3* – 16 – 7 – 4100 – 410 – 51 (51)
No, it makes sense. Your base squad size is actually closer to 5.3 (i.e. 16/3), but nowadays own squad size cannot be less than 10, so that’s what you see in the first encounter. Once it cleared the 10 cutoff, it continues to increase as expected for 5.3 SS. This floor of 10 is not implemented in the calculator.
Yea I was wondering if there was some lower cap’s not done in the spread. Btw, last week I started with much lower, think it was TSS of 4, 5 or 6. Somewhere around there, but I was close to chapter 2 and don’t recall if I had actually started it prior or after.
Currently I came up with my CAL of 20. Not sure if I had M = 27 or 28, but it makes lil difference as both will round to 20. So I was expecting my TSS to be that … but I guess not and instead is reference number system uses to get my TSS I guess. I feel so dumb and still trying to learn all this.
maxB = 171%
M = 27?
A = 0
V = 14
P = 0
Hey Minmax,
first of all, amazing work. I’m not sure what I appreciate more the formula or your easy to follow explanation of everything.
Anyway, I used you spreadsheet, double checked all my entries and still get SErr% of 17,42 (chapter 8). So maybe now you think this dude gotta be wrong – and I think so, too. But in my 5 other cities (all chapter 3) the SErr% is around a reasonable 5. So, I wanted to let you know and ask you for help, so that I learn more about it and maybe eventually find my mistake or contribute to improving the formula.
I also wanted to ask what’s your ingame name. If you don’t mind sharing it. If you do that’s, of course, fine, too.
Finally, I want to suggest that you will create a glossary – would definitely help 🙂
Thanks again!
Well, you have to give me more information than that. Username/world (optional, but helps to validate numbers), inputs for the model, ideally a screenshot of the research for the current chapter. Then I can take a look at the results. I haven’t had too many mid-level cities for calibration, so it is entirely possible that the model is less accurate in this area.
.
Having said that, are you sure that you’re talking about percentage numbers and not absolute values? Even 5% error would be extremely high, never mind 17%. I have never seen differences that high.