
Alright, so there were many questions and speculations about how Elvenar Spire squad size(s) are calculated. As far as I can tell, the calculation was never disclosed, except for statements that many different things have an impact on that – including total AW levels. But what is the formula? We’ve done quite a few modeling rounds already and got really close, but this model might just be the final one. I actually believe that we might be done here 😉 So without further ado, here is Model v5.0…
Table of Contents
* – * – *
Previous Work
As I mentioned, we’ve done several modeling rounds already, and a lot of information there is still very much relevant. To avoid copy/pasting ad infinitum, I’ll list previous work here, and may refer to it throughout the text. You almost certainly want to read it beforehand if you haven’t read it already. Having said that, a lot in this post I copy-pasted from Model v4.0 as this might be the final Spire squad size modeling post, and I’d like it to be more or less self-contained.
- Is here mostly for historical reasons; explains some basics and provides a limited model for the end-of-chapter-15 cities (end-game at the time)
- Our last formula still only for the end-of-chapter-15 cities
Model v2.1
Model v2.1 – Expansions
Model v2.1 – Ancient Wonders
Model v2.1 – Research
Model v2.1 – Misc
- Model v2.1 changes direction of analysis, and effectively lays foundation to Model v3.0. It looks at factors that we deem important for the calculation, and those components are still the same ones that we use in Model v3.0.
- Model v3.0 was our first general-purpose model, i.e. applicable to any city. Being a pure regression model it was pretty accurate, but the form was quite ugly, and it didn’t cover certain aspects of real-life behavior of Spire squad size (e.g. some research not having any impact).
- Model v4.0 was our first model that produced pretty accurate results across the board (except for the smallest cities) in a concise form.
- Model v4.1 was a minor refinement of parameters to v4.0.
Data Collection
So over the last few months I’ve been collecting data on the Spire, and now I am running a wider data collection effort. You can contribute to it in the comments below or on the forums here:
Spire squad size calc – we need your data!
The post in the link above also explains what’s needed and how to get it. We need your input! Also, look at this section that further describes what is needed. The more people participate, the faster we can converge to a reasonable model. Hopefully 😉
Definitions
Before we jump into the modeling, let me just say that when I say Spire squad size calculation I mean your own Spire squad size in the very first encounter (e.g. encounter 1 at stage 1 – Gateway). Once you know that number, you can calculate the rest of the Spire squad sizes in all the other encounters (both your own and your enemy’s). I already have that data, and describe it in Spire Requirements Calculation. Here we’ll work on the still unresolved issue of calculating that base Spire squad size number.
Model v5.0
So why do we need a new model, and a new major revision at that? Well, the only known shortcoming for v4.x Models is the fact that they do not work well for the tiniest of cities. We’re talking chapter 3, sub-150 SSS points kinds of cities (even though it is a bit broader than that). v4.x gets close in absolute terms, but relative errors there could reach 100% or more.
We addressed this shortcoming in Model v5.0. This also required bringing in a new underlying variable. And as this might just be the final model, this warranted a new model revision.
A good news is that Model v4.1 is not becoming obsolete per se – it turns out, that Model v5.0 is just a more general model, and Model v4.1 is really just a specific (and very common) variant of that. We’ll discuss this in more detail down below.
Underlying Variables
Before we get to the formula, we need to talk about what are the underlying variables used there. Most are described in more detail in corresponding sections of the Model v2.1, as well as in Model v3.0, Model v4.0 and Model v4.1. But there are certainly differences with the previous versions. So here are the variables that we used:
- M – total number of unlocked mandatory tech items (research)
- A – total number of AW levels
- P – number of placed premium expansions
- V – number of placed non-premium expansions (including initial 6)
- X – total number of placed expansions (including initial 6)
- maxB – maximum unlocked boost percentage for T1/T2/T3 goods
M, A, P, V and X variables stay the same as in Model v4.1. I probably need to clarify what I mean by mandatory tech items. In this context it is simply tech items that have dependent nodes. So if a research item doesn’t have any children, then unlocking it doesn’t impact Spire squad size. We’ll discuss it in more detail in the insights section.
maxB
maxB is a new variable in Model v5.0. This is just a maximum percentage of relic boosts for T1, T2 and T3 goods. If T3 boost is not unlocked yet, then maxB is the maximum boost for T1 and T2 goods only (even if you have a ton of T3 boosted relics). You can see your relic boosts on the Relics tab of the Main Hall. As an example, if your boosts are at 381%/557%/433%, then your maxB is 557%.
It is hard to say whether we should include Mountain Halls boost here or not, but this question is purely academic. By the time one can unlock and build Mountain Halls, pretty much every city would have their relic boosts maxed out. I don’t expect to find any use cases where Mountain Halls boost applies to less than max base boost, but if you have data on such a city let me know, we may only need a single observation to figure out the difference.
And that’s it, just these 5 parameters (you use either V or X) can explain the variance in the base Spire squad sizes really, really well. As usual, with the data collected so far 😉
Formula v4.1
Just for reference, here are v4.1 formulas (both are equivalent):


Formula v5.0
OK, we all know that this is why you’re here 😉 So:


The first form makes it easier to see what is going on. I.e. both premium and non-premium expansions add to Spire squad size, but premium ones only add 75% of what non-premium do.
The second form is slightly easier to calculate as total number of expansions is directly observable.
Both forms are equivalent. You may also notice that v5.0 looks very similar to v4.1 as far as M, A, X, V and P variables are concerned.
And here is a Google Sheets calculator for the Model v5.0. You’ll need to copy it in order to be able to edit.
Model Accuracy
Well, considering that you’re reading this post, you may suspect that this model actually works. So let’s see (you may need to click in to zoom):
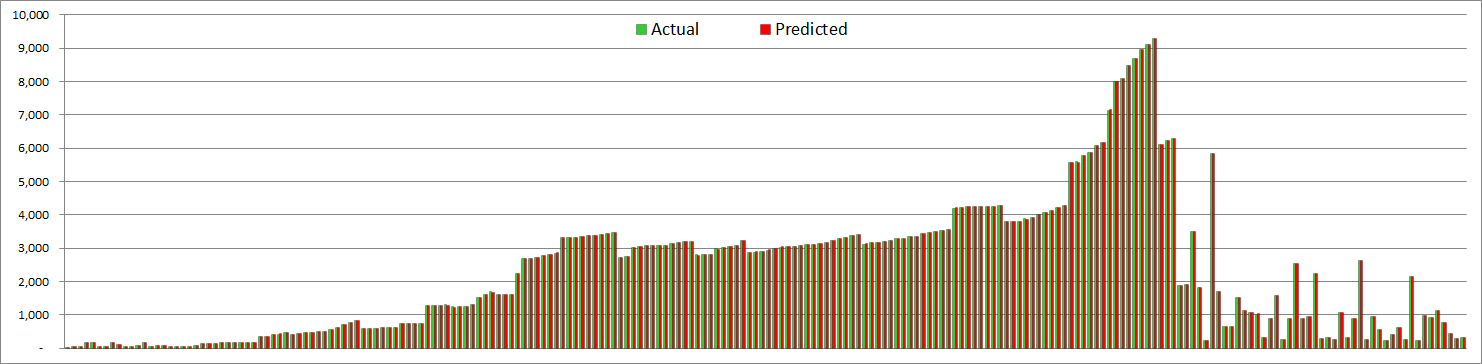
OK, so on this scale there is no real difference even with Model v3.0, never mind v4.x variants. All do a very good job at matching values across the whole spectrum. There is nothing that can be gleaned from this chart except that the model roughly works. We need to take a closer look to see the differences. Absolute modeling errors look like this:
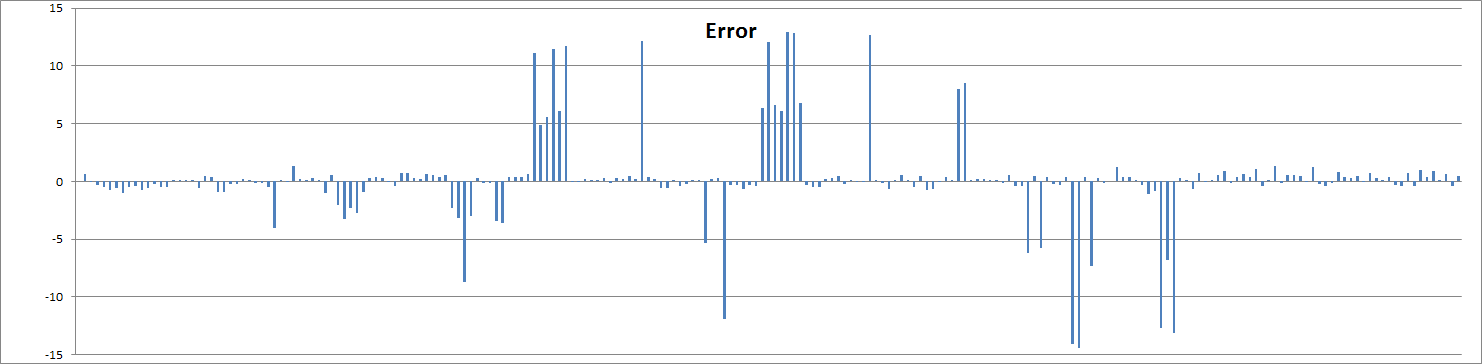
This is… pretty good 😉 And this time around, I didn’t need to remove small city outliers the way I did it previously. These are actual modeled errors for all the observations that I collected so far – and that’s more than 200 datapoints.
As you can (almost) see, the vast majority of observations have model errors of less than 1 point. That’s what we call a rounding error. You may also still see a few spikes in 5-15 range, but literally every single one of them is likely a data collection error – meaning it’s either A or M number that is off by 1 or 2, and after adjustment for that the results would also be bang on.
Input Data Errors
This is not just a sleight of hand. As you can see, most of the errors are clustered around 5-6 and 10-12 or so, with not much in between. That’s a good indication that it is the input data issue, as off-by-1 errors will translate into bigger discrete jumps in SSS. Also, most of the cities with spikes match very well on other datapoints, and are off only on some weeks. For actual model errors we would see a lot more dispersed errors – not jumps like that.
So I left these deviations in on purpose, so you can see that the data is not perfect. Seeing some errors does not mean that the model is incorrect.
v4.1 vs v5.0
And just for kicks let’s look at model errors between v4.1 and v5.0:
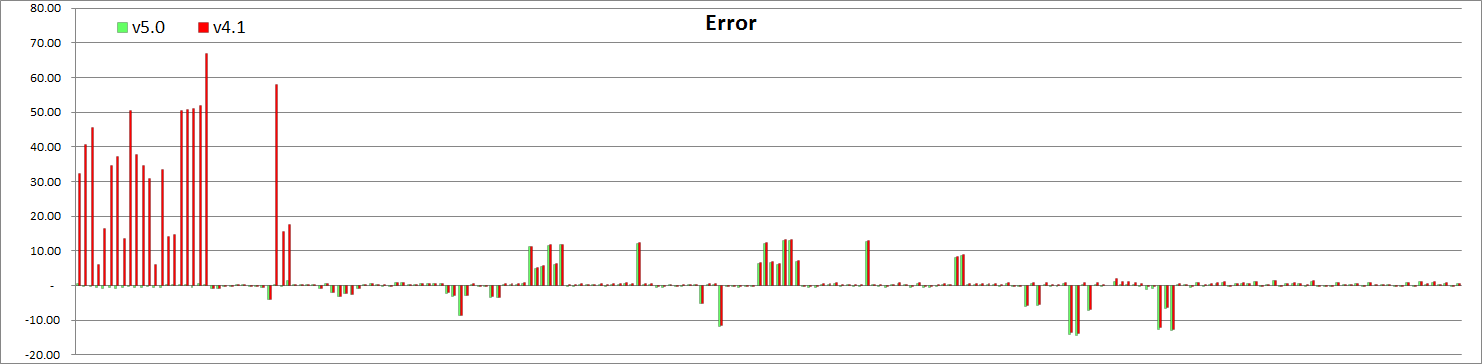
Again, I did not remove small city outliers this time around. So you can see that errors match pretty much exactly for most of the cities. Except for the tiny cities where v4.1 generated up to 60+ points errors, and v5.0 does not. Suffice to say, v5.0 is vastly better for the tiny cities, and is the same for the rest. And no more areas of concern across the board. Nice!
Insights
So, is this formula how Spire squad size is calculated? Finally?! Well, finally I must say that I see no reason to doubt that. The format of the formula might be different (different factorization etc), but it has to be pretty much equivalent to what we have here. It’s really hard to fit that many datapoints that closely just by accident 😉 And there are only 5 variables, they all make sense, the formula makes sense for something that is actually designed, and the fit is just too good on that many observations to be a fluke.
Model Makes Sense
If you remember, the formula in Model v3.0 was pretty ugly. And as I mentioned, despite a decent fit the original model is unlikely to be designed the way it is in Model v3.0, regardless of numerical parameters. This is a purely regression model; it is designed to fit observations (even though with some rational choices behind it) – rather than something that would be designed by the game developers.
Now, Model v4.0 changed that. This is a rather simple model (relatively), that looks like something designed by a human. It is factored into independent components corresponding to research, AW levels and expansions, which is what you would do if you design such a thing. And Model v5.0 just added another independent factor related to base relics boost – which also makes sense. And all these components are experimentally confirmed to have an impact on Spire squad size, and we don’t have any other questionable variables in there.
I have also rounded coefficients in Model v5.0 formula to make it more likely to be something designed. There are no super-weird coefficients here (e.g. super-sensitive 8-digit precision), and all look quite sensible. And the fit still is excellent.
The formula also avoids negative and zero numbers, which can be a problem with factored formulas. Research term is an exponent, so always >1. AW component is also >= 1 even with zero AWs. Expansion term is >=1 as V is always at least 6 or more. Boost component is obviously positive. Again, all this makes sense, which is a very good sign.
Better Research Impact
Experimentally, we observed that sometimes unlocking new research doesn’t change Spire SS, and sometimes it does. Model v3.0 doesn’t explain that (outside of rounding errors), but Model v4.0 (and Model v5.0) does by switching from T variable to M variable. It seems that only tech items with child nodes matter, and it is matches experimental observations. The reason why Model v3.0 worked reasonable well even with T variable is because it also had S (regular squad size), and most of the differences between T and M are due to optional squad size upgrades, and S correlates with that. So in effect, Model v3.0 approximated M variable with T and S.
Explains Changes Well
This model also doesn’t seem to exhibit error drift for individual cities, even for several weeks of observations. So it doesn’t match just individual observations, but it also matches changes with evolution of underlying parameters over dozens or hundreds of points in Spire SS changes. This is a very good thing, meaning that this model explains SSS changes due to the observed parameters pretty well.
Model Issues
And for the first time, there are no outstanding issues with this model. The only problem in v4.x was tiny cities – and we corrected it with introduction of the relics boost component. Take a look:
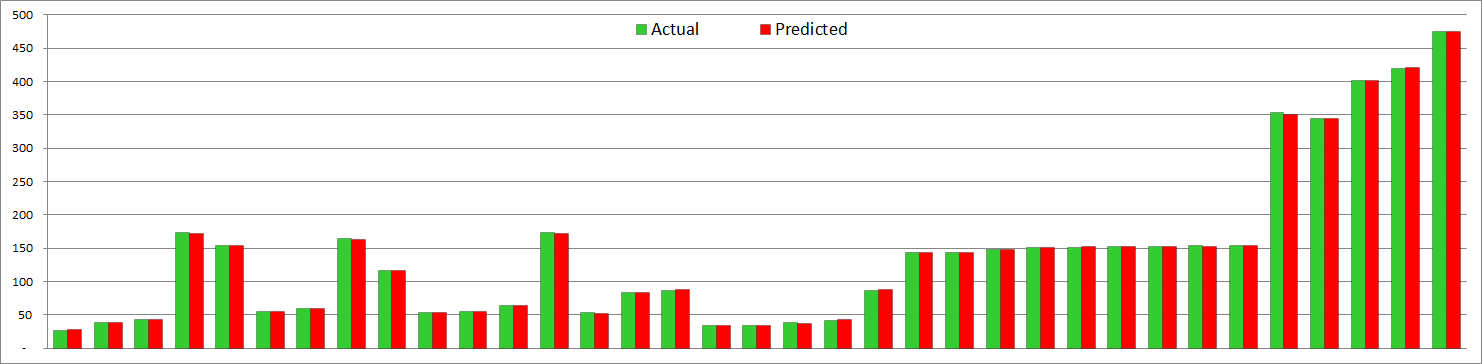
I’d say that it works fine now – for all observations 😉
Interpretation
Now, with the usual disclaimer in place, let’s assume that our model is a real thing. What would that mean?
Multiplication
The fact that research term is a multiplier means that the same changes in other parameters lead to different changes in Spire SS. The more research you’ve done, the higher the impact. We can say the same about AW levels as that term is also a multiplier. Ditto for expansions. Relics boost component is slightly different as it is capped, so it can be assumed constant over the long term.
This behavior is certainly that we can see in actual data, so our model explains that.
Research
So the research term (1.0042M) is pretty easy to explain. It basically means that if other parameters stay the same, a single extra unlocked mandatory research will increase your base Spire squad size by 0.42%. That’s it 😉 The model is pretty sensitive to this coefficient, so it is almost certain that this is the right number (given that overall model is correct). Clean experiments also confirm this number.
This also means that amount of KPs in research doesn’t matter. Partially filled research doesn’t matter. Filled but not paid for research doesn’t matter. And research with no dependent nodes doesn’t matter. So from that perspective taking optional SSU techs won’t impact Spire SS at all. But it’s not just optional SSU – any optional research (expansions, culture etc) won’t have an impact.
One interesting observation is that the last research item in the tech tree doesn’t have any dependents, so from that perspective it does NOT count. And right now chapter 16 is the last chapter, and it has 3 final techs. Taking any of those does not change your Spire SS (matches observations so far).
This also means that when chapter 17 tech tree gets populated, some of these final techs may become mandatory automagically, even without doing anything in the city. We may see a jump to Spire SS for end-game cities when chapter 17 gets added (not when city starts playing chapter 17!)
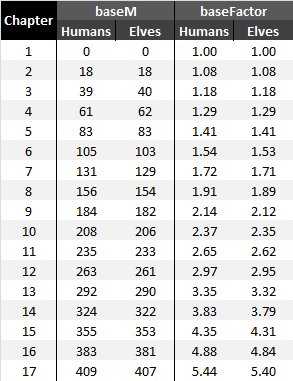
M Values per Chapter
Another interesting thing about this approach is that everyone at the end of each chapter will have the same research multiplier, regardless of which optional techs you did or did not take before that. This also makes sense from the design perspective, so another argument for this being real. You can use the table below to get base M value for your chapter, and then add manually counted number of unlocked mandatory tech items from your current one:
Ancient Wonders
AW term is (0.003A+1), meaning that for every ~333 AW levels you get 1x Spire SS increase. E.g. if your Spire SS with no AWs whatsoever is 1x, then adding ~333 AW levels will double it to 2x, ~667 AW levels will triple it to 3x and 1000 AW levels will quadruple it to 4x. If you keep your research and expansions constant (e.g. end-game), then you will be adding the same points per AW level, on average.
It also means that only total AW levels matter. Kind of AW does not matter. Specific size, level, KP contributions etc do not matter. AWs with KPs contributed but not upgraded do not count as an increase. This generally agrees with experimental observations (with some rounding noise on top).
Expansions
We can also see different coefficients for premium expansions (P) and non-premium expansions (V). This means that adding a single premium expansion increases your Spire SS less than adding a single non-premium expansion. Formulas in v4.1 and v5.0 make it clear that adding 1 premium expansion will only add 75% of SSS increase comparing to adding 1 non-premium expansion. We do see evidence of that in the data.
If you keep your research and AW levels constant, then you will be adding the same points per expansion kind (premium and non-premium differ).
Relics Boost
Relics boost component has a form of (0.4391*min(maxB, 700%) + 0.5). maxB can vary from 0% to 700% (and perhaps more, if we take Mountain Hall boosts into consideration). But the min(maxB, 700%) term means that this is capped at 700%. Which basically means that once a single one of your T1/T2/T3 boosts reaches 700%, this whole term becomes a constant and does not change anymore, ever. And if you plug in maxB=700% here, you’ll see that this term turns into pretty much 3.574. Meaning that with maxB at 700% or more, Model v5.0 is exactly the same as Model v4.1. And that’s the reason why v4.x works really well for most of the cities – that’s because most of the cities in the analysis have reached their max boost at least on a single regular good.
Basically, most cities do not need to worry about variability of this term. It is capped, and once this cap is reached it stays constant forevermore.
But more importantly, did you notice that there is a MinMax component in the formula? This is clearly a sign that this formula is finally the correct one! 😉
Regular Squad Size
Not a factor anymore! So players who did take optional SSUs are not penalized for that in the Spire at all. Enough said 😉
Other variables
Nothing else has an impact on the Spire squad size. Moving up a chapter doesn’t matter outside of completion of another research item (confirmed experimentally). Main Hall upgrades do not matter (also confirmed experimentally). Number of relics past 500 does not matter.
Basically, all kinds of other things that were considered to have an impact do not actually matter.
Conclusion
So we did get a new and improved model this time around. It didn’t change the fit where the previous model worked well, and it fixed the outstanding issues for where v4.x did not work well. So now it truly seems to work across the whole spectrum of cities. And predicted results match the observations very well. And this time around, it just makes sense.
More importantly, we uncovered that MinMax is a part of the final formula. This is pretty much undeniable proof that it is correct. I think we might be done here! 😉
So you can already start playing with this formula and see if your city data fits. Most of the parameters are easy to observe, except for the total unlocked mandatory research. I have posted (above) the table of these values for each completed chapter, so you can use that and add manually calculated number from your current chapter. The rest is pretty easy.
*-*-*
So that’s it for now. As there are no outstanding issues right now, there is nothing left to do, except monitoring new data for some unexpected results. Let me know in the comments if your city does or does not match well with the model forecast. It would be particularly interesting if it doesn’t, especially if significantly so. But if your results are more than a couple of points away from Model v5.0 predictions, the first things I would suggest is to check you input data. Research numbers are commonly done incorrectly, so double check that. AW levels also can be tricky as it seems that AWs that are still upgrading do count as completed for the Spire SS calculation – unlike, say, Trader bonus calculation where these would not.
If you’re still off after double checking your inputs, let me know. But so far every single city lined up very accurately with this model, after considering input errors as per above.
I think that’s all there is to it 😉


![Read more about the article Elvenar – Manual Fighting – Dust Tournament – 2019-01-04 [Thor]](https://minmaxgame.com/wp-content/uploads/2019/04/Emf-2019-01-03-dust.webp)
![Read more about the article Elvenar Sorcerers & Dragons – Day 19 [59%]](https://minmaxgame.com/wp-content/uploads/2019/04/SDFeaturedD19.webp)
![Read more about the article Elvenar – Manual Fighting – Gems Tournament – 2019-01-08 [Thor]](https://minmaxgame.com/wp-content/uploads/2019/05/Emf-2019-01-08-gems.webp)
![Read more about the article Elvenar Woodelves – Day 29 [84%]](https://minmaxgame.com/wp-content/uploads/2019/03/WoodelvesFeaturedD29.webp)
![Read more about the article Elvenar Orcs – Day 29 [76%]](https://minmaxgame.com/wp-content/uploads/2019/03/OrcsFeaturedD29.webp)
Is the enemy squad size in the Spire based off our Spire squad size?
Yes (or both depend on the same underlying variable). Take a look here: https://minmaxgame.com/spire-requirements-calculation/
Great work, well done!
I have some tiny amendment:
Since your data points for small cities are in the range of 50 SSS, they have an inevitable rounding error upto 2%. A fit of 3.574 = (0.44675 * (1+RelicBoost)) instead of (0.4391* RelicBoost + 0.5) should be within that error bar. It would swap an arbitrary 0.4391 inside a factor for an arbitrary 0.44675 outside of all factors, and feature a very natural (100% base production plus x% RelicBoost). The min(…) can be dropped if it is really just the relic boost and Mountain Hall has no effect. What do you think?
Going further, 0.44675 looks a lot like 4/9 and might integrate into (4X – P – 16) /9 … but I guess that is too far from data even if an overly-cautious programmer actually did a 1.0042^(M+1). Or is it? Judging from the enemy troop size in the first three encounters, the programmer actually liked a factor of 4/9 😉
Merry greetings,
Turbina
These are good points. Let me try to respond as much as I remember, without dusting off the whole model 😉 IIRC I did think about factoring out (1+RelicBoost) as that indeed would be more natural, but one of the things that I tried to minimize was a number of digits in coefficients (i.e. I assumed that something like 1.41 would be more likely than 1.412) – basically, penalizing coefficients that require more precision (given that we know that some human designed that model). And factored out form needs 0.44675 (5 digits), while v5.0 needs only 0.4391 and 0.5 (so only 4 digits). Now, this is by no means definitive, and I don’t remember if factored out form gave any meaningful differences to fit of small cities. Probably not. So now when we know that v5.0 formula works pretty accurately, we can certainly write it out in factored form as you did. But realistically, the vast majority of people would only care about 3.574 term, no matter how it is calculated 😉
.
min can be dropped, but then it will have to be basically lifted into definition of what constitutes RelicBoost, so that’s a wash. With min in the formula it is easier to apply so you don’t need to think whether other bonuses count or not.
.
No, 0.44675 is a very sensitive coefficient so definitely is not the same as 4/9=0.44444. Think about it – v5.0 formula works bang on with Spire SS up to almost 10,000. That difference in coefficients works out to almost 50 for 10K SSS. That would be a big break. Even with M+1 the difference still will be ~10. Close, but not that close.
.
And I wouldn’t be factoring into (4X – P – 16) regardless. The whole point of factoring was to lift coefficients as much as possible, and just leave terms that are easy to understand. This term would be hard to interpret.
.
In any case, thanks for your feedback and paying attention to details 😉 Keep it up!
How about Magical buildings, do they have any effect?
No, not at all.
Thank you and I appreciate your work 🙂
Thank you very much for this post. It´s really useful.
I have a question. Changes to every input data after the Spire or Tournament started are not taken into account as the event progresses, right?
On the other hand, I have obtained 14.4 as SErr, is this a reasonable error? I have double-checked every input data.
Chapter: 11
Expansions: 91
Next Premium Cost: 2000
Chapter Progress: 20
Total AW Levels: 124
maxB: 700%
These input data gave me a ForecastS of 1168.6 and the real value is 1154.3. This means I got a SErr of 14.4 and a SErr, % of 1.24%.
Thank you in advance.
This is an old model, you should be looking at https://minmaxgame.com/tournament-and-spire-requirements-2020/. I have a few updated coefficients even comparing to that model, and with that I am seeing 0.5% error for your numbers, which is fine for this use case. That’s even assuming that your reported numbers are not slightly off (this is pretty common unless you’re reporting several weeks in a row).