
Alright, so there were many questions and speculations about how Elvenar Spire squad size(s) are calculated. As far as I can tell, the calculation was never disclosed, except for statements that many different things have an impact on that – including total AW levels. But what is the formula? We’ve done a few modeling rounds for specific cases already, but now is the first time when we’re going to take a stab at general model. Exciting times! So, let’s dive into Model v3.0…
Table of Contents
* – * – *
Previous Work
As I mentioned, we’ve done several modeling rounds already, and a lot of information there is still very much relevant. To avoid copy/pasting ad infinitum, I’ll list previous work here, and may refer to it throughout the text. You almost certainly want to read it beforehand if you haven’t read it already.
- Is here mostly for historical reasons; explains some basics and provides a limited model for the end-of-chapter-15 cities (end-game at the time)
- Our last formula so far, still only for the end-of-chapter-15 cities
Model v2.1
Model v2.1 – Expansions
Model v2.1 – Ancient Wonders
Model v2.1 – Research
Model v2.1 – Misc
- Model v2.1 changes direction of analysis, and effectively lays foundation to Model v3.0. It looks at factors that we deem important for the calculation, and those components are still the same ones that we use in Model v3.0.
- Model v2.1 didn’t provide a specific formula for the Spire squad size, but most of the information and underlying analysis there are still relevant. If you want to understand how Model v3.0 came to be, you definitely want to read up on Model v2.1.
Data Collection
So over the last few months I’ve been collecting data on the Spire, and now I am running a wider data collection effort. You can contribute to it in the comments below or on the forums here:
Spire squad size calc – we need your data!
The post in the link above also explains what’s needed and how to get it. We need your input! Also, look at this section that further describes what is needed. The more people participate, the faster we can converge to a reasonable model. Hopefully 😉
Definitions
Before we jump into the modeling, let me just say that when I say Spire squad size calculation I mean your own Spire squad size in the very first encounter (e.g. encounter 1 at stage 1 – Gateway). Once you know that number, you can calculate the rest of the Spire squad sizes in all the other encounters (both your own and your enemy’s). I already have that data, and describe it in Spire Requirements Calculation. Here we’ll work on the still unresolved issue of calculating that base Spire squad size number.
Model v3.0
The fundamental change for v3.0 is that this is the first model that is supposed to be applicable to any city. Remember, Iteration 1 and 2 were only covering end-of-chapter-15 cities. Now, we can incorporate cities from chapter 3 all the way to behemoths that are getting close to finishing chapter 16.
Considering this means that formula is supposed to cover Spire squad size range of 27-9000 across 100+ different datapoints, I did not expect much for the first attempt 😉
But considering that fit turned out to be surprisingly decent – all things considering – I decided to post this as Model v3.0. So let’s see what do we have here.
Underlying Variables
Before we get to the formula, we need to talk about what are the underlying variables used there. Most are described in more detail in corresponding sections of the Model v2.1, so I’ll be concise here. So here are the variables used:
- T – total number of unlocked tech items (research)
- A – total number of AW levels
- S – regular squad size
- P – number of placed premium expansions
- V – number of placed non-premium expansions (including initial 6)
That’s it, just these 5 parameters can explain most of the variance in the base Spire squad sizes. Well, with the data collected so far 😉
Formula
OK, we all know that this is why you’re here 😉 So:

And now for the only 2 people who are still reading – this is not that bad. I’ll explain, I promise! 😉 But before we go there, does it even work?
Model Accuracy
Well, it is kind of surprising to me that it does, so far. That’s the reason I am posting it as is, even though it is clearly not the final version. So let’s see (you may need to click in to zoom):

That is… not too bad! It is close enough on every datapoint, so that we have to look at errors specifically. And absolute modeling errors look like this:
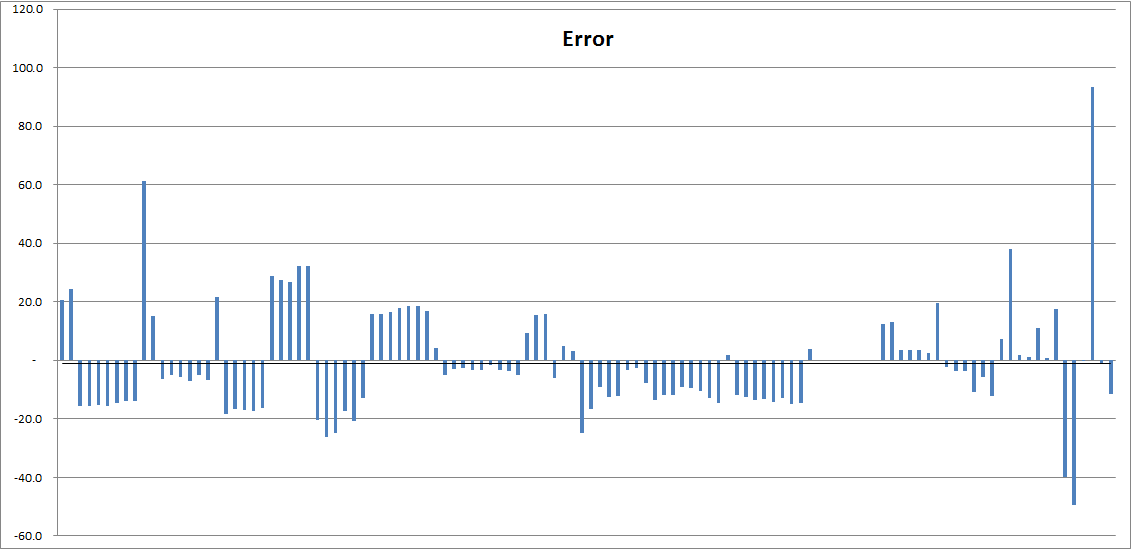
This is still not too bad, to say the least! The vast majority of differences between actual and modeled Spire squad size are within 20-30 points. Considering that most of these SS are in the thousands, this is exceptionally good. If it is real, that is 😉
Disclaimer
So, let’s cut to the chase – is this formula how Spire squad size is calculated? Nah, probably not again 😉 While we have more data now – more than 100 relatively clean observations – there is a pretty good chance that this close model match is just a result of overfitting to observations that are not sufficiently different from each other.
The Bad
And as you may be able to tell just by looking at the formula, it is unlikely to be designed the way it is in Model v3.0, regardless of numerical parameters. This is a purely regression model, designed to fit observations (even though with some rational choices behind it) – rather than something that would be designed by the game developers.
The formula doesn’t work quite well at very small Spire SS. It still usually gets within 20-30 points, but on the tiniest of cities this might be a factor of 2x. I am not too worried about that as it is directionally correct, i.e. gives significantly smaller results for cities with smaller SS.
The Good
That’s not to say that the model is useless. Quite the contrary! Remember, it does explain at least current data (which is non-trivial) quite well. And while I expect that the fit will get worse with more data, this formula may still explain quite a significant chunk of Spire SS variability.
It also doesn’t seem to exhibit much error drift for individual cities, even for several weeks of observations. This means that while there are some unexplained differences, they don’t change much with evolution of underlying parameters over dozens or hundreds of points in Spire SS changes. This is a very good thing, meaning that this model explains SS changes due to the observed parameters pretty well.
Some of the largest errors at the far right look worse than they are. Worst ones all come from the same city, and there is not much bias in the error. Meaning it shows -40 error one week, then almost zero, than almost +90, and then zero again. All that is over almost 1K of added Spire SS, to the existing 8K – so that’s a fairly extreme case. I am not overly concerned about this one either, as it is more consistent with observational errors (e.g. which changes are attributed to which week) rather than with pure model error. Then we would be likely seeing error drift, or large consistent errors. None of that is present so far.
It is actually more surprising to see 60 point error on the left. That’s a relatively vanilla city in chapter 7, and there are similar cities that fit quite well. User error is always an option though 😉
Interpretation
Now, with that disclaimer in place, let’s entertain a thought that our model actually does have some explanatory power, and not a complete regression artifact 😉 What would that mean?
Research
So the research term (1.004T) is pretty easy to explain. It basically means that if other parameters stay the same, a single extra unlocked research will increase your base Spire squad size by 0.4%. That’s it 😉 Now, more recent data may make us question whether or not the whole formula is even based on straight up number of techs (instead of, say, contributed KP etc). But it doesn’t mean that the formula above is not a good approximation given how research tree is structured.
Multiplication
The fact that research term is a multiplier also means that the same changes in other parameters lead to different changes in Spire SS. The more research you’ve done, the higher the impact. We can say the same about AW levels as these are also a multiplier.
This behavior is certainly that we can see in actual data, so our model explains that.
Expansions
We can also see different coefficients for premium expansions (P) and non-premium expansions (V). This means that adding a single premium expansion increases your Spire SS less than adding a single non-premium expansion. We do see some evidence of that in the data.
Regular Squad Size
One interesting result from this model regression is that regular squad size (S) seems to be a factor, and the only one with a negative loading. This means that higher regular SS actually provides some benefit for the Spire SS. The coefficients for S seem small, but both are significantly different from zero, and fit without them is clearly worse. Also remember, that S numbers are relatively large (in the thousands), comparing to other factors.
Negative dependency on S may make some intuitive sense. But before you get overly excited, remember that increased regular squad size means higher research (T) value. So perhaps negative loading on S is there so that people who took optional SSU research won’t just get hammered as much in the Spire as they do in tournaments.
Conclusion
So we did get a new and improved model this time around. And it even seems to work across the whole spectrum of cities. And predicted results match the observations pretty well. A bit too good to be true, if you ask me. I don’t think we’re quite there yet.
However, you can already start playing with this formula and see if your city data fits. Most of the parameters are easy to observe, except for the total unlocked research. This one you will likely have to just count yourself. Sucks, but you only do it once 😉
So that’s it for now. Let me know in the comments if your city does or does not match well with the model forecast. It would be particularly interesting if it doesn’t, especially if significantly so.
In the meantime, we’ll keep digging. There are still many questions left unanswered. But I am certain we’ll figure it out. Eventually 😉

![Read more about the article Elvenar Sorcerers & Dragons – Day 09 [29%]](https://minmaxgame.com/wp-content/uploads/2019/04/SDFeaturedD09.webp)


![Read more about the article Elvenar Sorcerers & Dragons – Day 29 [81%]](https://minmaxgame.com/wp-content/uploads/2019/04/SDFeaturedD29.webp)
![Read more about the article Elvenar Woodelves – Day 28 [82%]](https://minmaxgame.com/wp-content/uploads/2019/03/WoodelvesFeaturedD28.webp)
Nice work !
Have you tried reducing the number of empirically derived vvariables in the current approximation ? At the moment there are two coefficients for each of V and P, but the ratios between them are very similar. My guess is that they could be combined (into two weighted multiples of E say where E = V + aP and a ~ 0.68) and the resulting formula would score pretty much the same.
It would be nice to turn the formula into a product of research, AW and expansion terms, but the squadsize is problematic. Any chance that skipped (optional) squadsize updates somehow affect the formula ?
No, coefficients for V and P are significantly different, and it can be confirmed by placing regular and premium expansions back to back (you will see very different increments in advanced cities). And indeed, I’ve been looking to simplify the formula and make it more of a product of independent terms. And I think I am almost there 😉
.
Stay tuned for more updates! You would definitely want to check the next version – I think this might be the one that recovers the real underlying formula (at least in terms of model if not exact coefficients). It will be much simpler, too! 😉
I might not have been clear in what I wrote. I wasn’t suggesting that V and P have the same coefficients, but that the formula had more derived coefficients than it needed (which runs the risk of overfitting).
It may be irrelevant if the formula has already been improved, but I was suggesting as a first step something like:
(1.004**T) * (aE – 0.004S – 22 + 0.01A(E – 0.01S +37.5)) where E = bP+cV
Consider a =3.58 b=0.66 c=0.965. This has one fewer coefficient (decimal parameter) than the original formula and has only a small difference from the original of 0.1 * P * (1.004**T) which has a maximum (for a large diamond funded province) of about 15 – which is within your average error. We can tweak a,b,c within the neighborhood in various ways and I wondered whether optimising over them would help.
I see what you mean. Well, that formula was not really designed to recover the original model (that much is clear) – rather to focus on factors that would explain most/all of the variance. As such, there are definitely more degrees of freedom than needed, albeit not that much as to worry about overfitting at that point. Optimizing this form wouldn’t do us much good as the fit is not THAT great, and there are certain observations that do not fit well with the fundamental assumptions in this model.
.
I am waiting for a new batch of observations tomorrow, then if everything still checks out I’ll post about new model. Which for the first time has a good chance of being a real deal.